Figures & data
Table 1 The Characteristics of Different Formulations: Particle Size, Entrapment Ratio, Polydispersity Index and ζ-Potential. (Mean ± SD, n=3)
Figure 1 Transmission electron microscope of HSA-GEM/CUR NPs (A); RGD-HSA-GEM/CUR NPs (B); RGD-HSA-GEM/CUR NPs after 6 months (C).
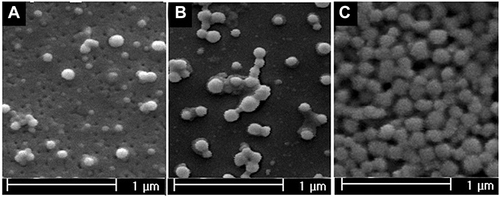
Table 2 Stability Test Observations of the RGD-HSA-GEM/CUR NPs at Room Temperature (Mean ± SD, n=3)
Figure 2 The release profile of drug in NPs in PBS (containing 0.1% Tween 80, pH 7.4) (n=6).
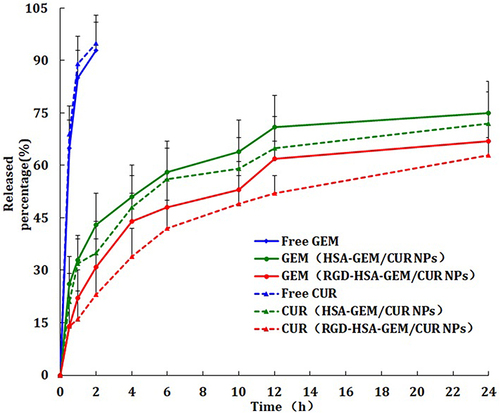
Figure 3 Confocal images of cellular uptake of Blank NPs (A); free GEM/CUR (B), HSA-GEM/CUR NPs (C) and RGD-HSA-GEM/CUR NPs (D) by SW1990 cells. Incubation time was 2 hours. (E) was the quantitative results. Bar=50 µm. (ap <0.05, RGD-HSA-GEM/CUR NPs vs Blank NPs; bp <0.05, RGD-HSA-GEM/CUR NPs vs free GEM/CUR, cp <0.05, RGD-HSA-GEM/CUR NPs vs HSA-GEM/CUR NPs).
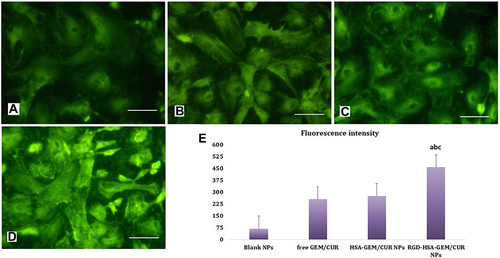
Table 3 The IC50 Values of Free Gemcitabine/Curcumin (GEM/CUR), Human Serum Albumin-Gemcitabine/Curcumin Nanoparticles (HSA-GEM/CUR NPs) and Arginine Glycine Peptide-Human Serum Albumin-Gemcitabine/Curcumin Nanoparticles (RGD-HSA-GEM/CUR NPs) Treated SW1990 Cells (Mean ± SD, n=6)
Figure 4 In vitro viability of different NPs formulations in SW1990 cells. Data represents mean ± SD (n = 3). A Cell viability cultured with Blank NPs; free GEM/CUR, HSA-GEM/CUR NPs and RGD-HSA-GEM/CUR NPs at various concentrations of GEM/CUR after 24 h. (ap <0.05, RGD-HSA-GEM/CUR NPs vs Blank NPs; bp <0.05, RGD-HSA-GEM/CUR NPs vs free GEM/CUR, cp <0.05, RGD-HSA-GEM/CUR NPs vs HSA-GEM/CUR NPs).
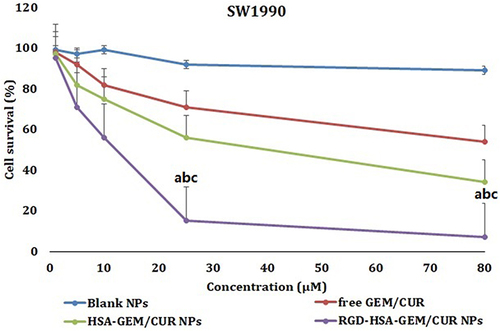
Table 4 The Mean AUC0-t and Target Index of Different Formulations of NPs in Different Organs of Mice (Mean ± SD, n=8)
Figure 5 In vivo biodistribution study of modified and non-modified GEM/CUR NPs (n=8). (A) tumor, (B) heart, (C) liver, (D) spleen, (E) lung, (F)kidney and (G) plasma. (ap <0.05, RGD-HSA-GEM/CUR NPs vs free GEM/CUR, bp <0.05, RGD-HSA-GEM/CUR NPs vs HSA-GEM/CUR NPs).
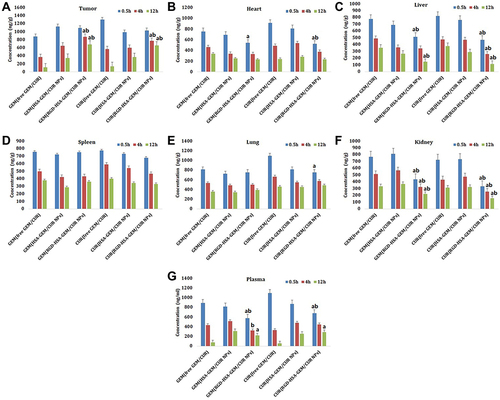
Figure 6 The in vivo imaging of DiR-loaded Blank NPs; free GEM/CUR, HSA-GEM/CUR NPs and RGD-HSA-GEM/CUR NPs in tumor bearing nude mice at 12 h (n=3).
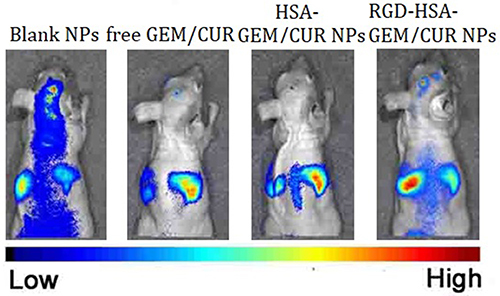
Figure 7 (A) The growth curves of SW1990 tumors in mice. (B) The changes in the body weight of SW1990 tumor-bearing mice. (ap <0.05, RGD-HSA-GEM/CUR NPs vs Blank NPs; bp <0.05, RGD-HSA-GEM/CUR NPs vs free GEM/CUR, cp <0.05, RGD-HSA-GEM/CUR NPs vs HSA-GEM/CUR NPs).
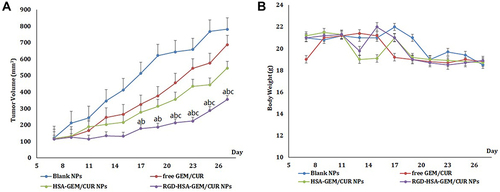
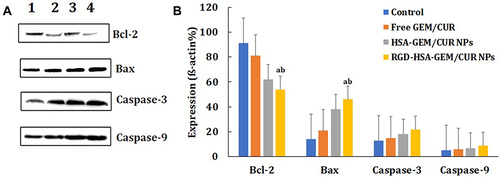
Figure 8 Analysis of apoptotic pathway proteins. Western Blot result of apoptotic protein expression (A) and expression of actin (B) on SW1990 cells after incubated with free GEM/CUR, HSA-GEM/CUR NPs and RGD-HSA-GEM/CUR NPs for 24 h (GEM/CUR 0.5 μM). (ap <0.05, RGD-HSA-GEM/CUR NPs vs Control; bp <0.05, RGD-HSA-GEM/CUR NPs vs free GEM/CUR).