Figures & data
Figure 1 Scheme graphs and TEM images of GE-DTX-NPs (A), HA-FMN-NPs (B), and HA/GE-DTX/FMN-NPs (C).
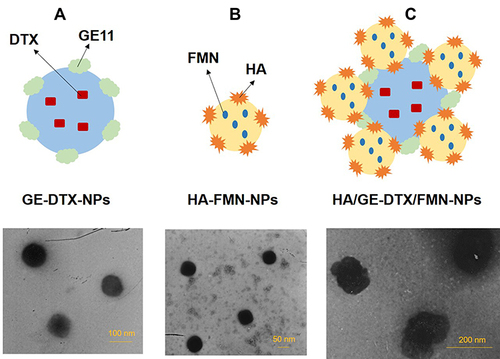
Table 1 Characterization of Nanoparticles
Figure 2 Stability of NPs during storage at 4°C (A), and in the presence of fetal bovine serum (FBS, 10%, v/v) at 37°C for 72 h (B). Data are presented as means ± standard deviation (n=3).
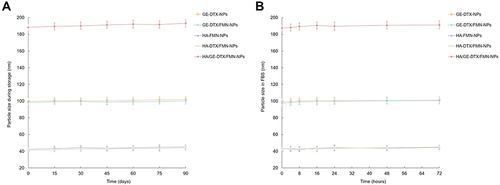
Figure 3 In vitro DTX (A) and FMN (B) release performed using dialysis method. Data are presented as means ± standard deviation (n=3).
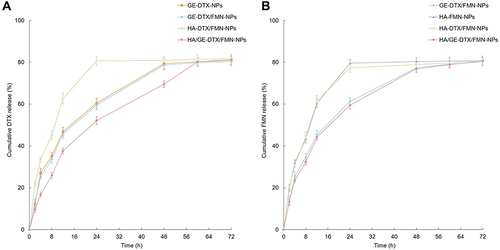
Figure 4 Cellular uptake efficiency of the coumarin 6-loaded NPs in PC3 cells: fluorescence images (A) and quantified by flow cytometer (B). Bars stand for 50 μm. Data are presented as means ± standard deviation (n=3). *P < 0.05.
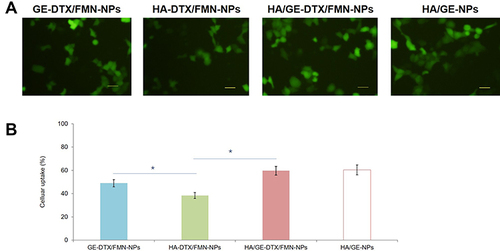
Figure 5 In vitro cytotoxicity of different formulations on PC3 cells (A) and RWPE-1 cells (B). CI values versus Fa at different DTX to FMN ratios (C). Data are presented as means ± standard deviation (n=3). *P < 0.05.
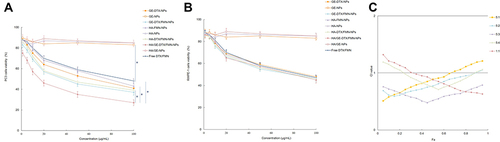
Figure 6 In vivo anti-tumor efficacy of different formulations in mice bearing human prostate cancer model: Tumor volumes and images. Data are presented as means ± standard deviation (n=8). *P < 0.05.
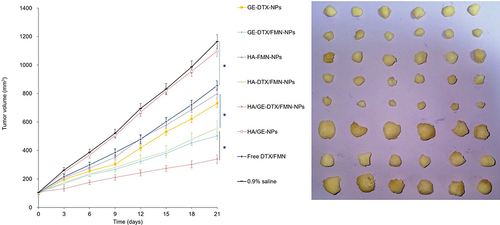
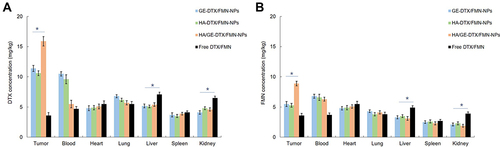
Figure 7 In vivo DTX (A) and FMN (B) tissue distribution. Data are presented as means ± standard deviation (n=8). *P < 0.05.