
Figures & data
Figure 1 The major metabolic process of imrecoxib.
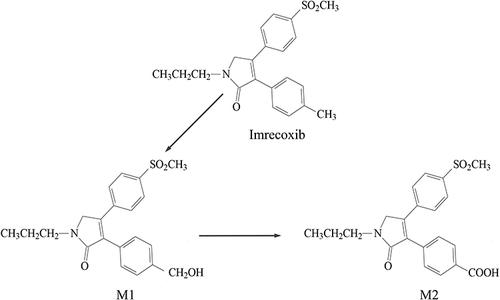
Figure 2 The flowchart of the study.
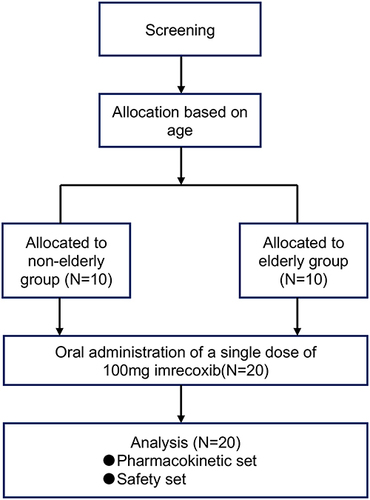
Table 1 Demographics of Enrolled Subjects
Figure 3 Typical chromatograms of imrecoxib (M0), M1, M2 and IS. (A–D) Chromatograms of M1 and IS in (A) blank plasma; (B) blank plasma containing IS; (C) blank plasma containing M1 and IS at their LLOQ values; and (D) the plasma sample collected 1h after an oral administration of 100 mg imrecoxib. (E–H) Chromatograms of M0, M2 and IS in (E) blank plasma; (F) blank plasma containing IS; (G) blank plasma containing M0, M2 and IS at their LLOQ values; and (H) the plasma sample collected 1h after an oral administration of 100 mg imrecoxib. Peaks I–IV shows imrecoxib (M0), M1, M2 and IS (BAP385), respectively.
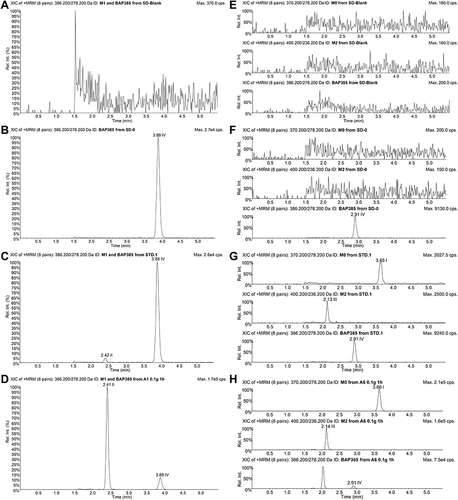
Table 2 Results of Plasma Pharmacokinetics of Imrecoxib (M0), M1 and M2
Figure 4 Individual and mean plasma concentration-time curves of imrecoxib (M0), M1 and M2. (A) The individual plasma concentration-time curves of M0, M1 and M2 in the non-elderly group (A1–A10). (B) The individual plasma concentration–time curves of M0, M1 and M2 in the elderly group (B1–B9). (C) The mean plasma concentration–time curves of M0, M1 and M2 in the non-elderly group (A) and elderly group (B).
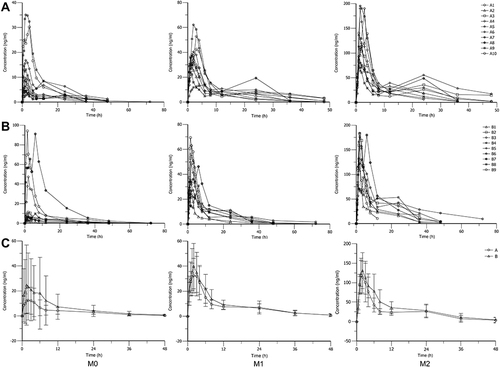
Table 3 Geometric Mean Ratio and Its 90% CI of Main Pharmacokinetic Parameters of Imrecoxib (M0), M1 and M2
Table 4 Summarization of All the Adverse Events