Figures & data
Figure 1 Schematic diagram of the study to explore the pharmacological mechanisms of MBSYQ in COPD-related osteoporosis.
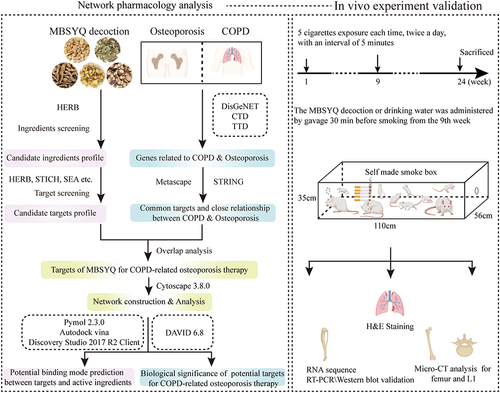
Figure 2 Co-bioinformatics analysis of the target of MBSYQ and 340 proteins in common between COPD & osteoporosis by Metascape. (A) Circos diagram of the 2 sets of proteins. The proteins appearing in the two sets of protein profiles are connected by purple lines, and proteins of the same ontological term are connected by blue lines. (B) The top 20 common GO terms or pathways enriched by 2 groups of protein profiles. (C) Enrichment network analysis of the 2 groups of proteins. A circular node represents a term whose size is proportional to the number of proteins, and the color represents the characteristics of the protein. When the similarity is greater than 0.3, it is connected by an edge, at which point the thickness of the edge represents the similarity. (D) In the enrichment network, nodes are represented as pies, and the sector of the pie is proportional to the hits in the 2 lists.
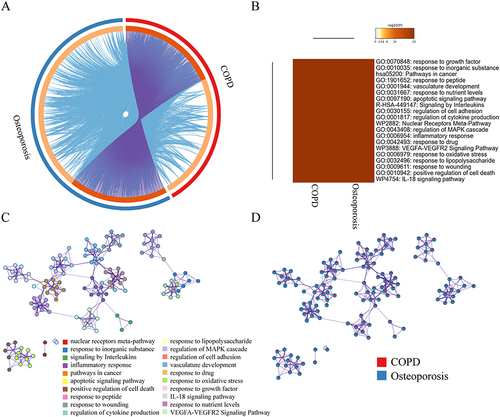
Figure 3 GO and KEGG analysis of potential components and targets of MBSYQ for COPD-associated osteoporosis by DAVID 6.8. Venn diagram of the 340 common protein profiles of MBSYQ with COPD and osteoporosis (A). Enrichment of the first 30 pathways of the KEGG pathways among 228 potential targets (B). The first 15 items of the rich GO program include biological processes (BP), cellular compartments (CC), and molecular functions (MF) (C).
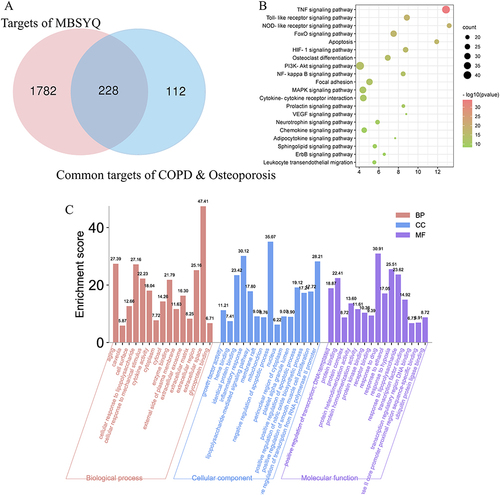
Figure 4 MBSYQ potential target-pathway (PT-P) network and potential component-potential target (PI-PT) network for COPD-related osteoporosis treatment. (A) PT-P network is based on the first 20 KEGG-enriched pathways. (B) PI-PT network based on PT-P network. (C) Relative positions of potential MBSYQ targets in the PI3K/AKT pathway. (D) Relative positions of potential targets of MBSYQ in MAPK pathway.
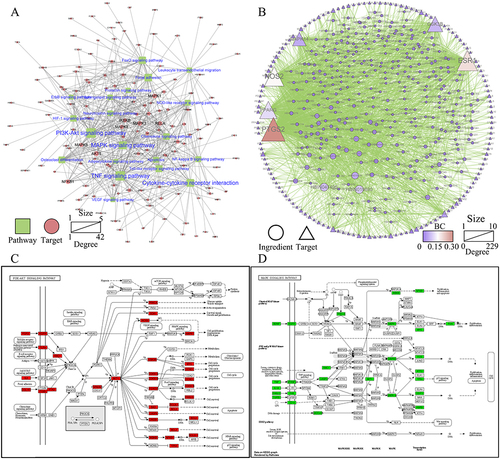
Figure 5 Molecular docking analysis of the core compounds of MBSYQ with key targets regulating MAPK and PI3K/AKT signaling pathways. Compound-target-pathway network (A), chemical structures of the six core compounds (B), predicted binding mode between AKT1 and wogonin (C), BCL2 and salidroside (D), GSK3β and quercetin (E), MAPK1 and luteolin (F), MAPK14 and apigenin (G), TNF and capsaicin (H). Cartoon patterns indicate protein binding, balls and bars indicate molecules, and lines indicate amino acid residues at the active site. The overall showed the two-dimensional and three-dimensional structure of the binding mode.
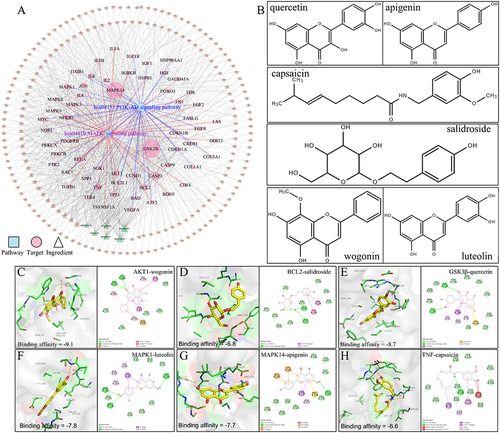
Figure 6 Cigarette smoking-induced lung inflammation and voids in rats can be attenuated by MBSYQ. (A) Lung section revealed by H&E staining. Alveolar inflammation scores (B), MLI (C), and MAA (D) were assessed. Data are presented as mean ± SD. ####p<0.0001, ###p<0.001 vs Control group; *p<0.05, **p<0.01, ***p<0.001 vs Model group.
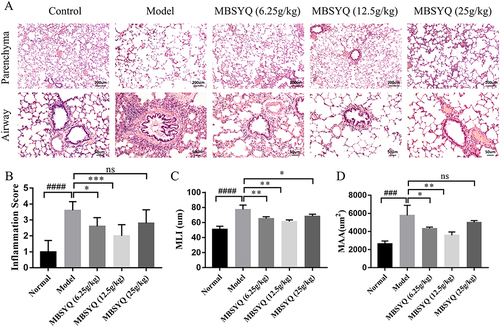
Figure 7 MBSYQ improves the BMD and bone microstructure of the femur and L1 induced by cigarette smoke. Representative scans of bone microstructure (A) and quantification of BMD of the femur (B) and L1 (C). #p<0.05 vs Control group.
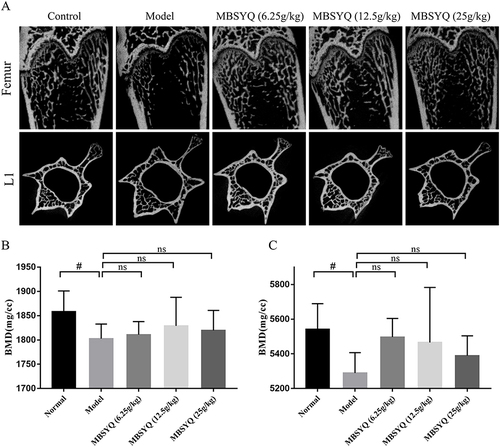
Figure 8 Quantitative analyses of trabecular parameters of the femur including. Micro-CT and Analyze12.0 were applied to determine the BV/TV (A), BS/TV (B), Conn.D (C), Tb.Sp (D), Tb.N (E), and Tb.Th (F). Data were expressed as mean ± SD. # P < 0.05, ## P < 0.01, ###P < 0.001 vs Control group. *P < 0.05, **P < 0.01, ***P < 0.001 vs CS exposure group.
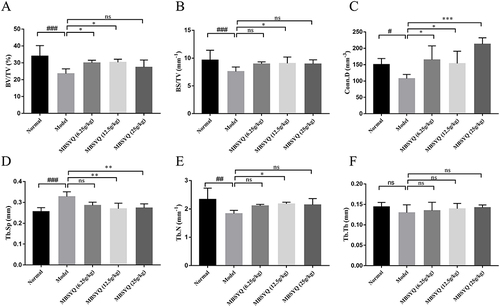
Figure 9 MBSYQ upregulates genes associated with anti-oxidative stress and aerobic respiration. GO Chord diagram of GO terms associated with oxygen metabolism and anti-oxidative stress (A), the heatmap of genes involved in the terms (B), and the PPI network of the genes (C). RT-PCR validation of core genes based on the PPI network, including GPX1 (D), GPX4 (E), Ndufa4 (F), and Uqcrb (G). ## P < 0.01 vs Control group.
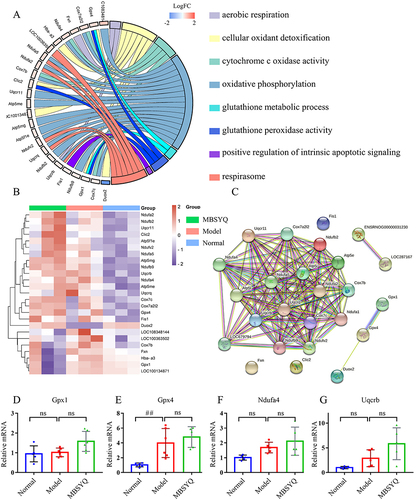
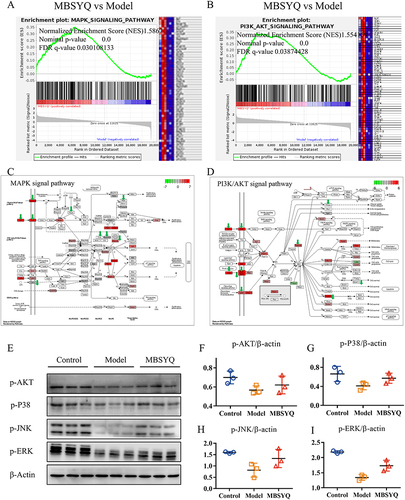
Figure 10 MBSYQ restored MAPK and PI3K/AKT pathways that were inhibited by cigarette exposure. GSEA enrichment showed that the MAPK pathway (A) and PI3K/AKT (B) pathway were significantly activated by MBSYQ. Differentially expressed genes are labeled in the MAPK (C) and PI3K/AKT pathways (D); green arrows indicate genes down-regulated by CS exposure and red rectangles indicate genes up-regulated by MBSYQ. Western blot validated the relevant pathways in the normal, model, and MBSYQ groups (E) and Image-Pro Plus 6.0 for quantification of Western blot data (F–I).