Figures & data
Figure 1 Representative spectra of SM, PEG, SM-PEG, DMSO, and dd-H2O.
Abbreviations: dd-H2O, distilled deionized water; DMSO, dimethyl sulfoxide; FL, fluorescence; FTIR, Fourier transform infrared spectroscopy; PEG, polyethylene glycol; SM, streptomycin; UV, ultraviolet.
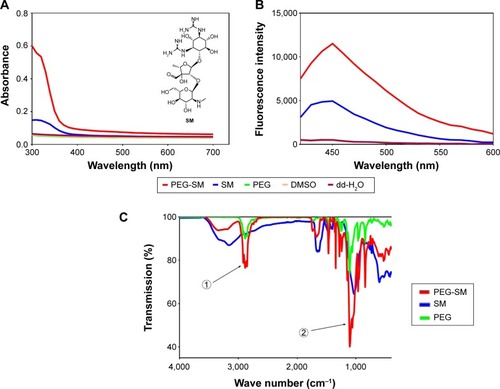
Figure 2 The morphology of newly synthesized NP-siRNA liposomes under SEM and TEM.
Abbreviations: NP, nanoparticle; PEG, polyethylene glycol; SEM, scanning electron microscopy; siRNA, small interfering RNA; TEM, transmission electron microscopy.
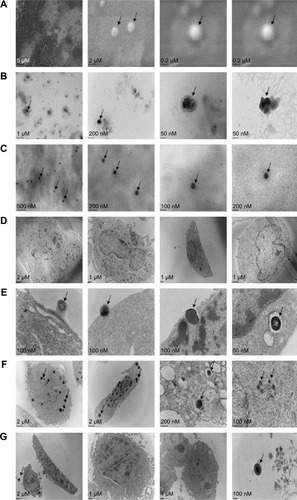
Figure 3 The size distribution of the novel NP-siRNA liposomes.
Abbreviations: NP, nanoparticle; PDI, polydispersity index; siRNA, small interfering RNA.
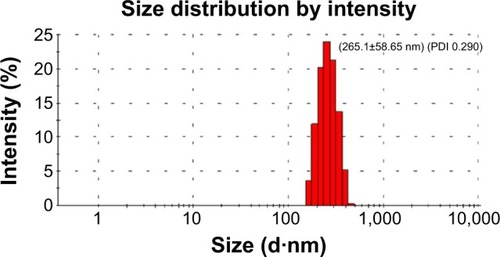
Figure 4 Drug release profiles of NP-siRNA liposomes containing the anti-TB drugs and free antidrugs determined by a dialysis method.
Abbreviations: ANOVA, analysis of variance; INH, isoniazid; LC–MS, liquid chromatography mass spectrometry; NP, nanoparticle; PZA, pyrazinamide; RIF, rifampicin; SD, standard deviation; siRNA, small interfering RNA; SM, streptomycin; TB, tuberculosis.
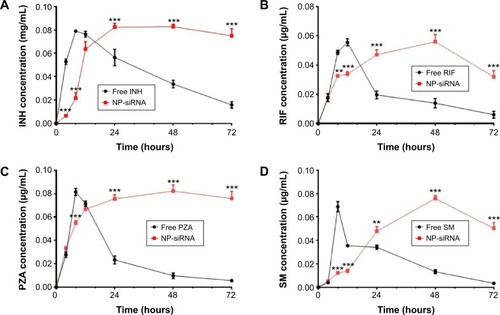
Figure 5 Cytotoxicity of the novel NP-siRNA liposomes and free anti-TB drugs toward THP-1-derived macrophages determined by the MTT assay.
Abbreviations: INH, isoniazid; MTT, thiazolyl blue tetrazolium bromide; NP, nanoparticle; PZA, pyrazinamide; RIF, rifampicin; SD, standard deviation; siRNA, small interfering RNA; SM, streptomycin; TB, tuberculosis.
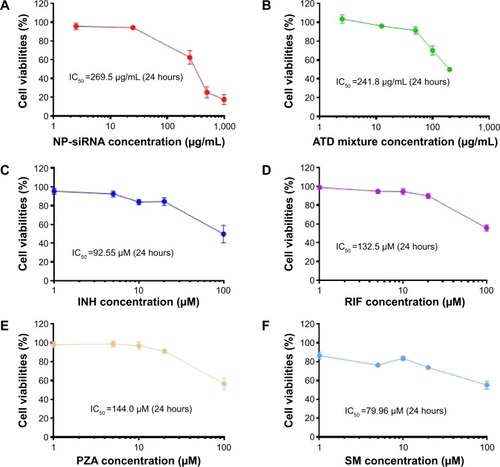
Figure 6 Effects of the novel NP-siRNA liposomes on cell cycle distribution, apoptosis, and autophagy in THP-1-derived macrophages.
Abbreviations: ANOVA, analysis of variance; NP, nanoparticle; SD, standard deviation; siRNA, small interfering RNA.
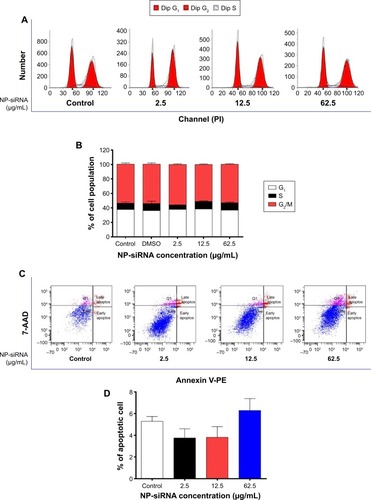
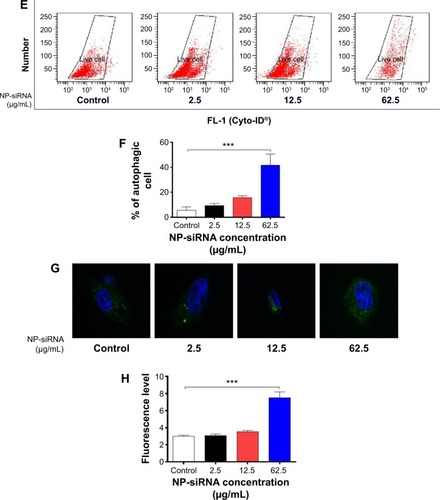
Figure 7 Effects of the novel NP-siRNA liposomes on the expression levels of pro- and antiautophagic proteins in THP-1-derived macrophages determined by Western blotting assay.
Abbreviations: ANOVA, analysis of variance; LC3, microtube-associated protein 1A/1B light chain 3; MAPK, mitogen-activated protein kinase; mTOR, mammalian target of rapamycin; NP, nanoparticle; PI3K, phosphoinositide 3-kinase; PTEN, phosphatase and tensin homologue; SD, standard deviation; siRNA, small interfering RNA.
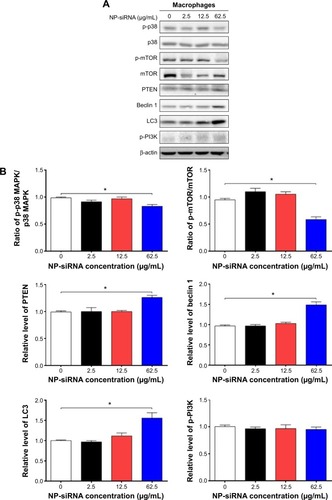
Figure 8 Effects of the novel NP-siRNA liposomes on the expression levels of TGF-β1, IL-6, IL-8, TNF-α, and IFN-γ in THP-1-derived macrophages determined by ELISA.
Abbreviations: ANOVA, analysis of variance; DMSO, dimethyl sulfoxide; IFN, interferon; IL, interleukin; ELISA, enzyme-linked immunosorbent assay; LPS, liposaccharide; NP, nanoparticle; SD, standard deviation; siRNA, small interfering RNA; TGF-β1, transforming growth factor-β1; TNF-α, tumor necrosis factor-α.
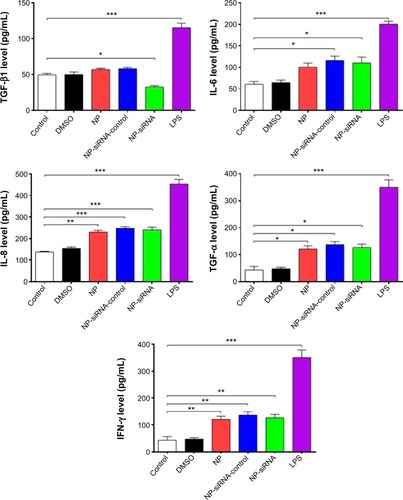
Figure 9 Effects of the novel NP-siRNA liposomes on the mRNA expression levels of TGF-β1, IL-6, IL-8, TNF-α, and IFN-γ in THP-1-derived macrophages determined by RT-PCR assay.
Abbreviations: ANOVA, analysis of variance; DMSO, dimethyl sulfoxide; IFN, interferon; IL, interleukin; NP, nanoparticle; RT-PCR, real-time polymerase chain reaction; SD, standard deviation; siRNA, small interfering RNA; TGF-β1, transforming growth factor-β1; TNF-α, tumor necrosis factor-α.
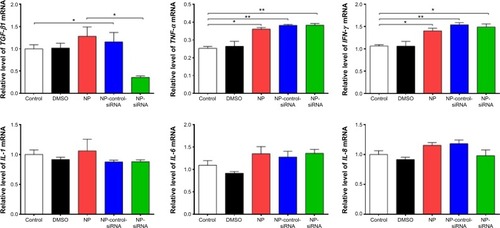
Table 1 The top five canonical signaling pathways regulated by the novel NP-siRNA liposomes in THP-1-derived in macrophages
Table 2 The top eleven upstream proteins regulated by the novel NP-siRNA liposomes in THP-1-derived macrophages
Table 3 The upregulated and downregulated proteins involved in TGF-β1-mediated signaling pathway in THP-1-derived macrophages treated with the novel NP-siRNA liposomes at 12.5 μg/mL for 24 hours
Figure 10 The proteomic profiling of human macrophages treated with the novel NP-siRNA liposomes at 12.5 μg/mL for 24 hours determined using SILAC.
Abbreviations: IPA, ingenuity pathway analysis; NP, nanoparticle; SILAC, stable isotope labeling with amino acids in cell culture; siRNA, small interfering RNA.
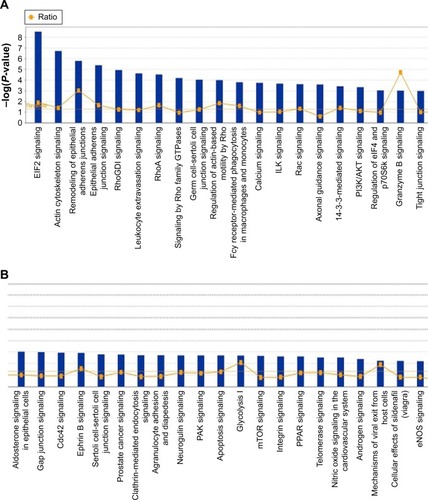
Figure 11 EIF2 signaling pathway was regulated when THP-1-derived macrophages were treated with the novel NP-siRNA liposomes at 12.5 μg/mL for 24 hours.
Abbreviations: EIF2, eukaryotic initiation factor 2; ER, endoplasmic reticulum; ERK, extracellular signal-regulated kinase; IPA, ingenuity pathway analysis; NP, nanoparticle; SILAC, stable isotope labeling with amino acids in cell culture; siRNA, small interfering RNA.
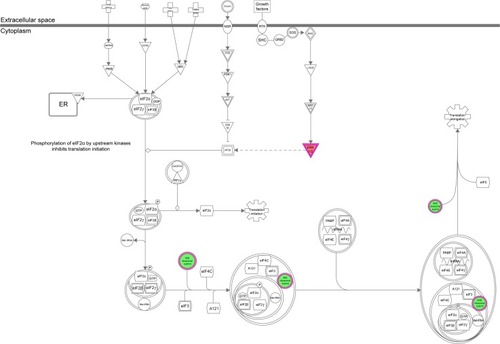
Figure 12 The ERK/MAPK signaling pathway was regulated when THP-1-derived macrophages were treated with the novel NP-siRNA liposomes at 12.5 μg/mL for 24 hours.
Abbreviations: ERK, extracellular signal-regulated kinase; IPA, ingenuity pathway analysis; MAPK, mitogen-activated protein kinase; NP, nanoparticle; SILAC, stable isotope labeling with amino acids in cell culture; siRNA, small interfering RNA.
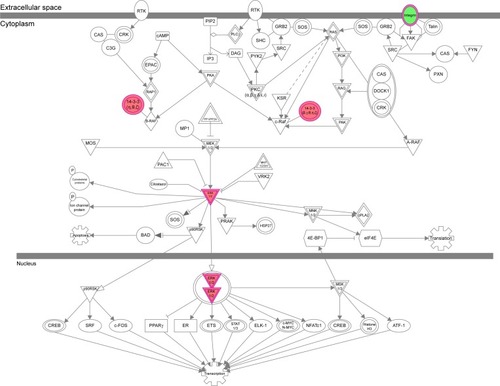
Figure 13 The NF-κB signaling pathway was regulated via ERK1/2 when THP-1-derived macrophages were treated with the novel NP-siRNA liposomes at 12.5 μg/mL for 24 hours.
Abbreviations: ERK, extracellular signal-regulated kinase; IPA, ingenuity pathway analysis; NF-κB, nuclear factor-κB; NP, nanoparticle; SILAC, stable isotope labeling with amino acids in cell culture; siRNA, small interfering RNA.
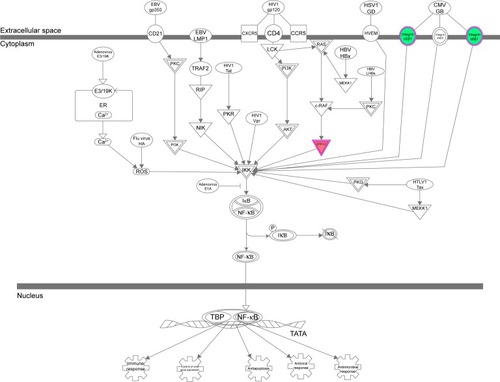
Figure 14 The PI3K/AKT and HSP90 interacted with ERK1/2 when THP-1-derived macrophages were treated with the novel NP-siRNA liposomes at 12.5 μg/mL for 24 hours.
Abbreviations: AKT, protein kinase B; ERK, extracellular signal-regulated kinase; HSP90, heat shock protein 90; IPA, ingenuity pathway analysis; NF-κB, nuclear factor-κB; NP, nanoparticle; PI3K, phosphoinositide 3-kinase; SILAC, stable isotope labeling with amino acids in cell culture; siRNA, small interfering RNA.
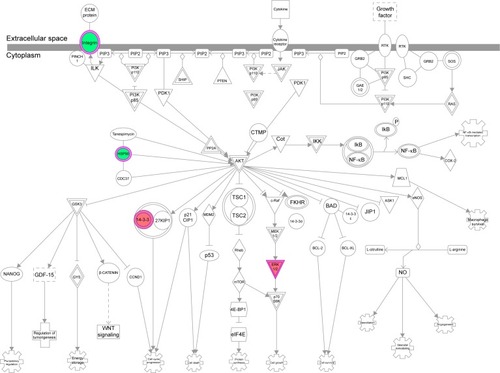
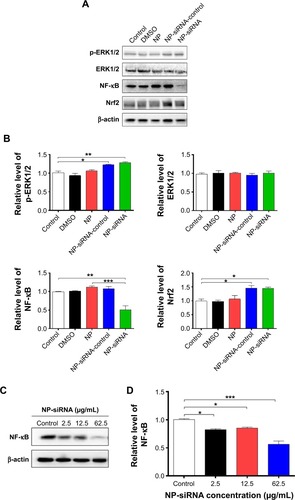
Figure 15 Effect of the novel NP-siRNA liposomes on the expression levels of p-ERK, ERK, NF-κB, and Nrf2 in THP-1-derived macrophages determined using Western blotting analysis.
Abbreviations: ANOVA, analysis of variance; DMSO, dimethyl sulfoxide; ERK, extracellular signal-regulated kinase; NF-κB, nuclear factor-κB; NP, nanoparticle; Nrf2, nuclear factor (erythroid-derived 2)-like 2; SD, standard deviation; siRNA, small interfering RNA.