Figures & data
Table 1 Flucytosine nanoliposomes expressed as molar ratios of lipid components, whereas glutathione–malemide–PEG2000–distearoyl phosphatidyle ethanolamine is expressed as percentage molar substitution
Table 2 Entrapment efficiency of flucytosine within targeted liposomes when different ratios of glutathione moiety were used (means ± SD [n=3])
Table 3 Zeta potential values of glutathione-targeted nanoliposomes (measurements ± SD [n=3])
Table 4 Particle size measurements and polydispersity index of targeted liposomes (measured ± SD [n=3])
Figure 1 Transmission electron micrographs of flucytosine-loaded nanoliposomes: (A) represents F1 liposomes without targeting moiety, (B) represents F2, (C) represents F3, and (D) represents F4.
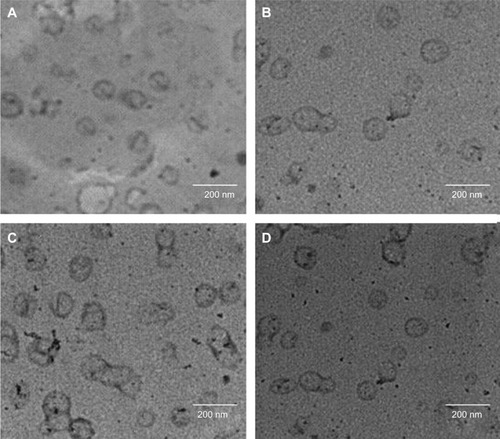
Figure 2 Percent drug released against time (h) from both glutathione-free and glutathione-modulated liposome formulae (F1–F4).
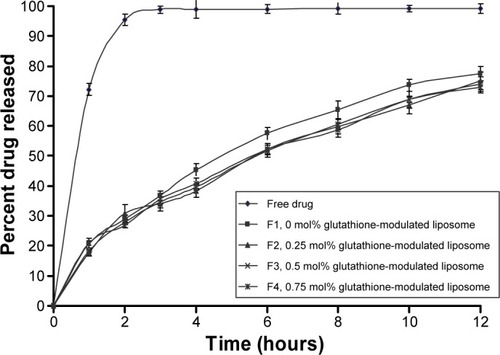
Table 5 The mean particle size measurements (nm) of the prepared vesicles during storage at 4°C±1°C, 25°C±1°C, and 37°C±1°C for three months (n=3, the values were the means ± SD)
Table 6 The entrapment efficiency measurements (%) of the prepared vesicles during storage at 4°C±1°C, 25°C±1°C, and 37°C±1°C for 3 months (n=3, the values were the means ± SD)
Figure 3 Intracellular uptake of liposomes functionalized with 0.75 mol% of glutathione moiety at different time intervals: (A) 0 hour and (B) at 6 hours, and intracellular uptake of primary cell culture pretreated with excess free glutathione and then incubated with liposomes functionalized with 0.75 mol% of glutathione moiety at different times intervals (C) 0 hour and (D) 6 hours.
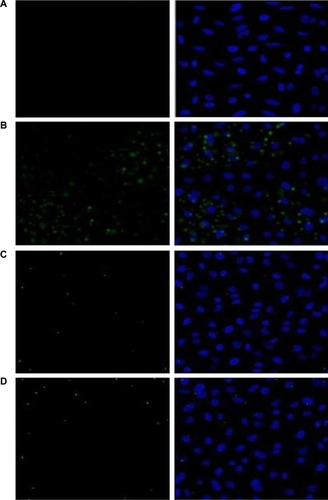
Figure 4 A dot-plot representation of flow cytometry data of green fluorescent cells LR (lower right quarter) and nonfluorescent cells LL (lower left quarter) within cultured primary rat brain cells are represented.
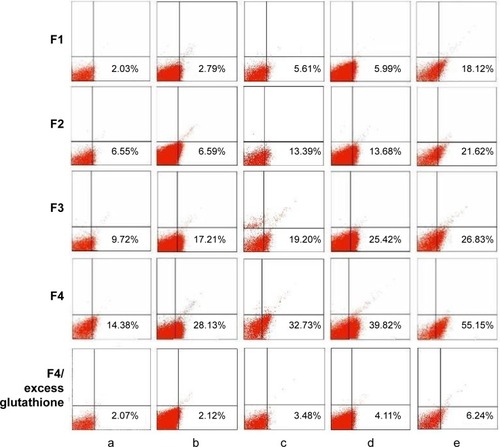
Figure 5 The uptake of glutathione-labeled liposomes (F1–F4) when added into the primary brain cells of rats and also the competition assay of formula (F4) incubated with the cells (pretreated with excess glutathione) during a 24-hour incubation period.
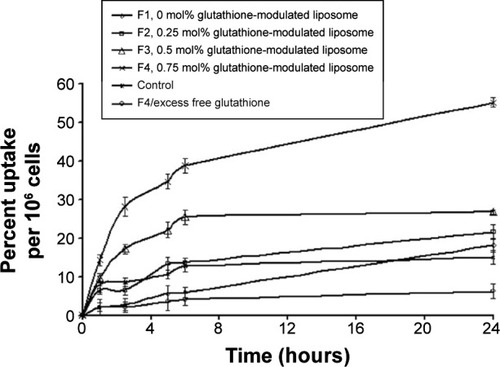
Figure 6 Flow cytometric measurements of glutathione-modulated liposomes when incubated with cultured primary rat brain cells for 24 h.
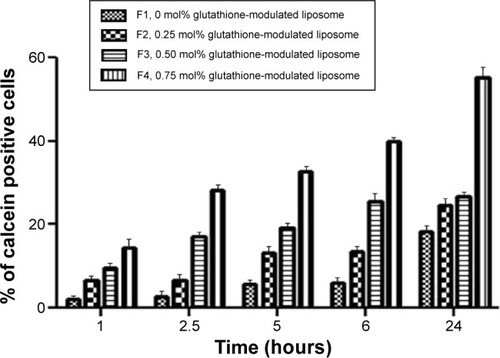
Figure 7 Flucytosine concentration (μg/g) in the plasma and brain 30 minutes postintravenous injection of flucytosine solution (10 mg/kg) or flucytosine-loaded liposomes functionalized with 0%, 0.25%, 0.50%, or 0.75% mole/mole glutathione moiety (F1–F4).
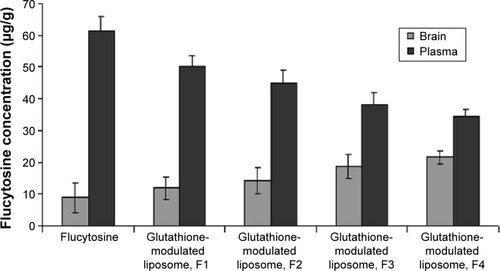
Figure 8 Comparison of (Cbrain/Cplasma)flucytosine ratios of flucytosine or flucytosine-loaded liposomes (F1–F4). Cbrain, Cplasma: flucytosine concentration (μg/g) in the brain or plasma 30 minutes postintravenous injection of flucytosine solution (10 mg/kg) or flucytosine-loaded liposomes functionalized with 0%, 0.25%, 0.50%, or 0.75% mole/mole glutathione moiety (F1–F4).
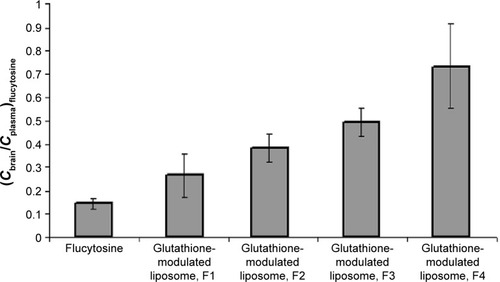
Figure 9 Flucytosine concentration in the plasma and brain (μg/g) versus time postintravenous injection of flucytosine-loaded liposomes functionalized with 0% and 0.75% mole/mole glutathione moiety (F1 and F4, respectively).
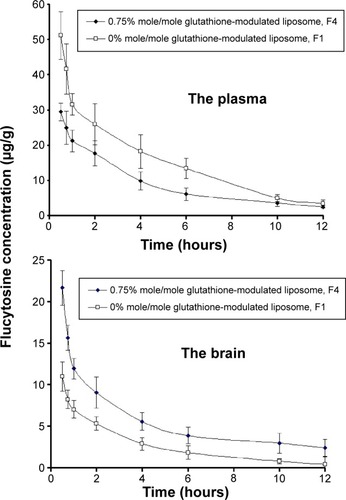
Figure 10 (Cbrain/Cplasma)flucytosine ratios of flucytosine-loaded conventional liposomes (F1) and flucytosine-loaded liposomes (F4) versus time (h). (Cbrain/Cplasma)flucytosine concentration (μg/g) in the brain or plasma postintravenous injection of flucytosine-loaded conventional liposomes (F1) (equivalent to 10 mg/kg) or flucytosine-loaded liposomes functionalized with 0.75% mole/mole glutathione moiety (F4).
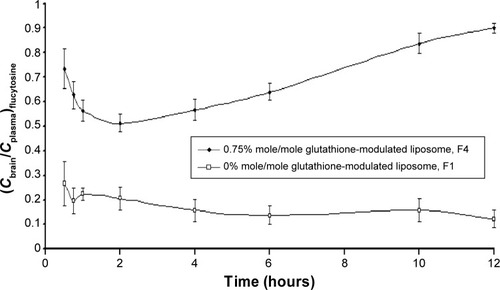
Table 7 Pharmacokinetic parameters of flucytosine in brain, plasma, and certain tissues of rats, postintravenous injection of flucytosine-loaded 0% mole/mole glutathione-modulated liposome (F1) or flucytosine-loaded 0.75% mole/mole glutathione-modulated liposome, F4 (equivalent to 10 mg/kg of flucytosine) (n=3, P<0.05)
Table 8 Targeting efficiency of flucytosine-loaded 0.75% mole/mole glutathione-modulated liposome (F4) compared with flucytosine-loaded 0% mole/mole glutathione-modulated liposome (F1) postintravenous injection of flucytosine-loaded liposomal formulae (equivalent to 10 mg/kg) in male rats (n=3)
Table S1 Molar concentration of lipids and surfactants in the prepared liposomal formulations
Table S2 Entrapment efficiency values of flucytosine in flucytosine-loaded liposomes formulae (means ± SD [n=3])
Table S3 Zeta potential values of flucytosine-loaded liposomes (measured ± SD [n=3])
Figure S1 Percent drug released against time (h) from both free drug and flucytosine-loaded liposome formulae (S1–S9).