Figures & data
Figure 1 Absorption spectra of 5-fluorouracil (5-FU) in enzyme-free simulated gastric fluid (SGF) and enzyme-free simulated intestinal fluid (SIF).
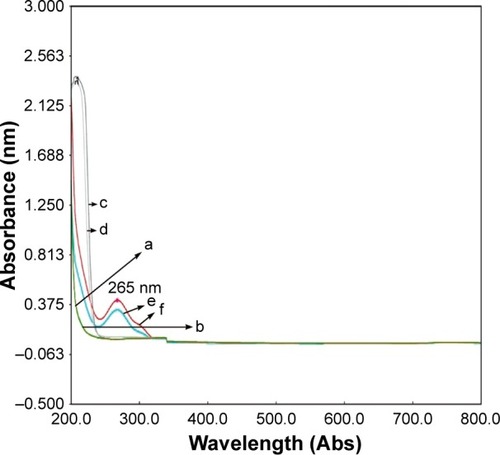
Figure 2 Representative HPLC chromatograms of 5-fluorouracil (5-FU) in rabbit plasma: (A) blank plasma; (B) blank plasma spiked with 5-FU; and (C) plasma sample after oral administration of 5-FU hollow microspheres.
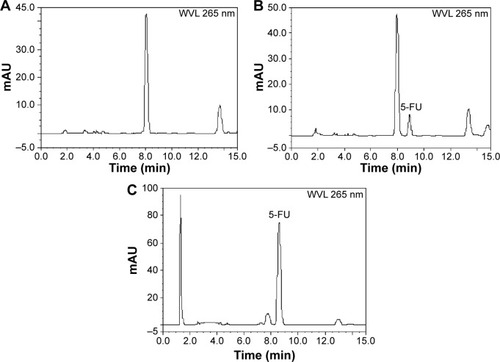
Figure 3 Representative HPLC chromatograms of 5-fluorouracil (5-FU) in tumor-bearing mice biosamples: (A) blank tumor; (B) blank tumor spiked with 5-FU; and (C) tumor sample after oral administration of 5-FU hollow microspheres.
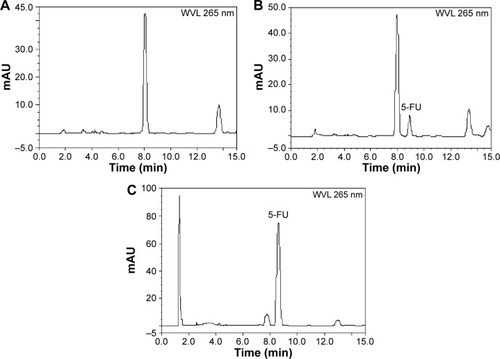
Table 1 The effect of Span 80 concentration in the liquid paraffin on particle size, drug loading amount, and production yield of 5-fluorouracil hollow microspheresTable Footnotea
Table 2 The effect of ether/ethanol volume ratio on particle size, drug loading amount, and production yield of 5-fluorouracil hollow microspheresTable Footnotea
Table 3 The effect of PVP/EC weight ratio on particle size, drug loading amount, and production yield of 5-fluorouracil hollow microspheresTable Footnotea
Figure 4 Effect of PVP/EC weight ratio on floating behavior of 5-fluorouracil hollow microspheres in simulated gastric fluid (A) and simulated intestinal fluid (B).
Abbreviations: EC, ethyl cellulose; PVP, polyvinyl pyrrolidone.
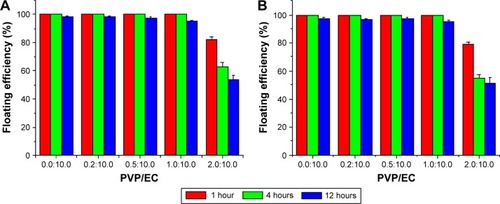
Figure 5 Effect of PVP/EC weight ratio on in vitro release behavior of 5-fluorouracil hollow microspheres in simulated gastric fluid (A) and simulated intestinal fluid (B).
Abbreviations: EC, ethyl cellulose; PVP, polyvinyl pyrrolidone.
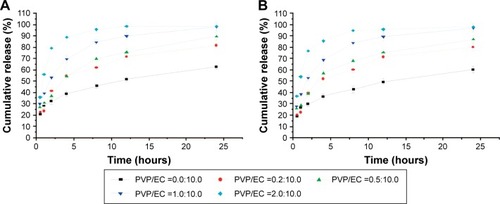
Table 4 The particle size, drug loading amount, and production yield and floating efficiency of 5-fluorouracil hollow microspheresTable Footnotea
Figure 6 Scanning electron microscopy photographs of 5-fluorouracil hollow microspheres (batch: 20120401).
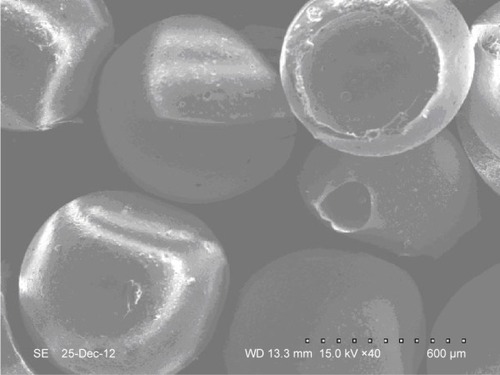
Figure 7 Percentage cumulative release of three batches of 5-fluorouracil hollow microspheres in simulated gastric fluid (A) and simulated intestinal fluid (B).
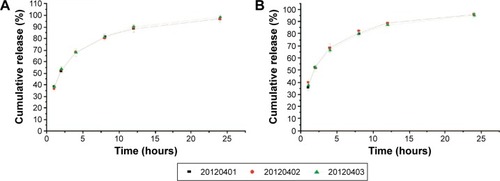
Table 5 Pharmacokinetic parameters of 5-FU after oral administration of 5-FU hollow microspheres and its solid microspheres and powder to rabbits at a dose of 50 mg/kg body weightTable Footnotea
Figure 8 Plasma drug concentration–time curve after oral administration of 5-fluorouracil (5-FU) hollow microspheres and its solid microspheres and powder to rabbits at a dose of 50 mg/kg body weight.
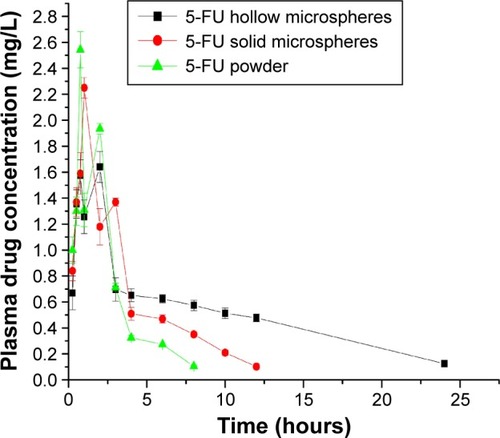
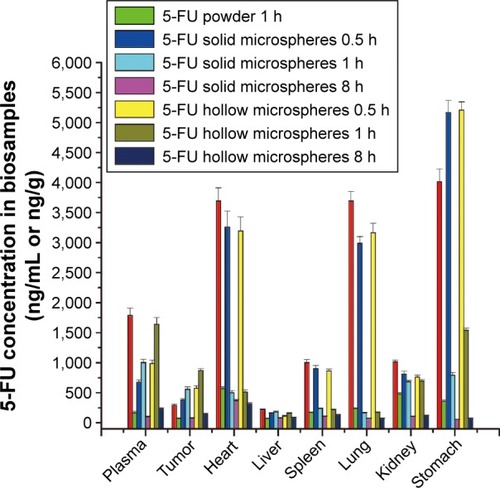
Figure 9 Drug distribution in plasma, tumor, and main tissues including heart, liver, spleen, lung, kidney, and stomach in tumor-bearing mice after oral administration of 5-fluorouracil (5-FU) hollow microspheres as a test formulation and its solid microspheres and powder as controls in the sodium carboxymethyl cellulose suspension form at a dose of 72 mg/kg body weight.
Abbreviation: h, hours.