Figures & data
Table 1 Effect of Pinus gerardiana on Rats’ Body Weight, Liver Weight/Index and Total Protein in Different Studied Groups
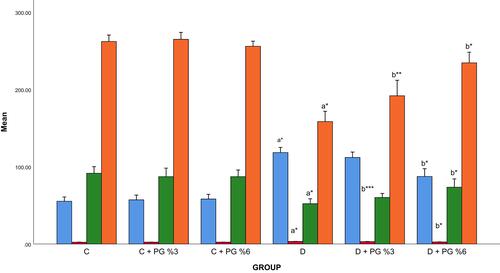
Figure 1 Effect of Pinus gerardiana on rats’ water and food consumption in different studied groups.
Notes: Results were expressed as mean ± SD. C, normal control group; PG, Pinus gerardiana; D, diabetic group. aSignificant proportion of the healthy control group. bSignificantly compared to diabetic control group. **p<0.01 and *p <0.001.
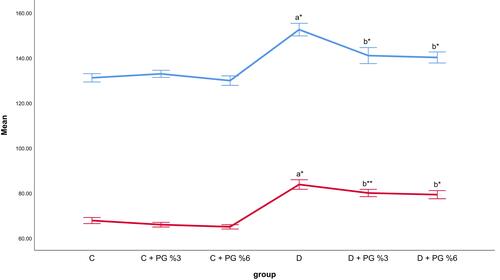
Figure 2 Effect of Pinus gerardiana on fasting blood glucose, insulin and HOMA-IR in different studied groups.
Notes: Results were expressed as mean ± SD. C, normal control group; PG, Pinus gerardiana; D, diabetic group. aSignificant proportion of the healthy control group. bSignificantly compared to diabetic control group. **p<0.01 and *p <0.001.
Abbreviation: FBS, fasting blood sugar.
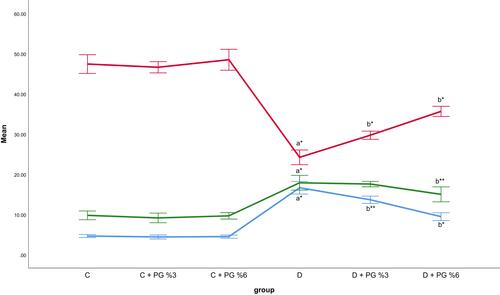
Table 2 Effect of Pinus gerardiana on Antioxidant Barrier Parameters (TAC, SOD)
Table 3 Coefficient (r) and Significance of the Correlation Between the Tissue and Serum Antioxidant Barrier Parameters
Table 4 Coefficient (r) and Significance of the Correlation Between the Tissue and Serum Oxidative Damage Parameters
Figure 3 Effect of Pinus gerardiana on oxidative damage parameters (MDA, TT).
Notes: Results were expressed as mean ± SD. C, normal control group; PG, Pinus gerardiana; D, diabetic group. aSignificant proportion of the healthy control group. bSignificantly compared to diabetic control group. ***p<0.05, **p<0.01 and *p <0.001.
Abbreviations: MDA, malondialdehyde; TT, total thiol molecules.