Figures & data
Figure 1 Flow chart of trial selection.
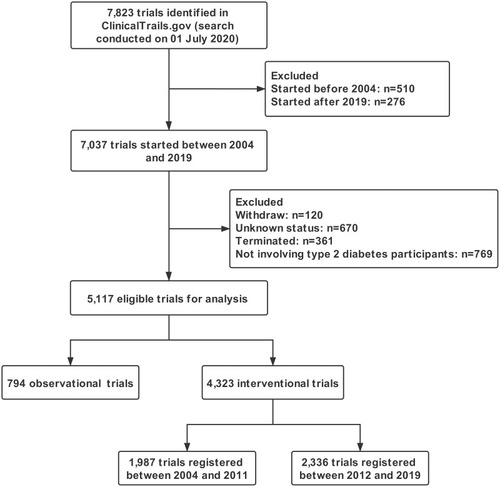
Figure 2 Distribution of the eligible clinical trials according to the registered year.
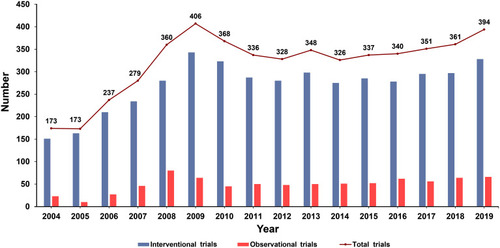
Table 1 Characteristics of Interventional and Observational Trials
Table 2 Trend of Changes in the Characteristics of Interventional Trials Registered Between Two Temporal Subsets
Figure 3 Distribution of the common antidiabetic drugs studied in all T2DM-related clinical trials (A) and in T2DM-related intervention trials (B) between two temporal subsets (2004–2011 and 2012–2019). The sum of the percentages may exceed 100% as categories were not mutually exclusive.
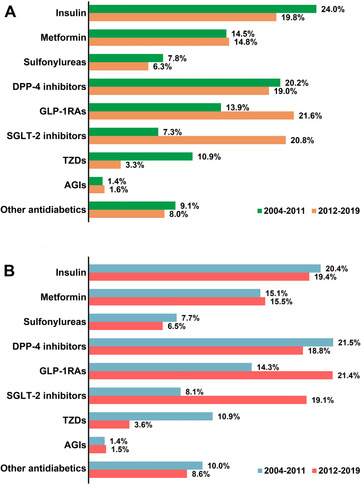
Table 3 Characteristics of Completed Interventional Trials According to the Publication Statusa
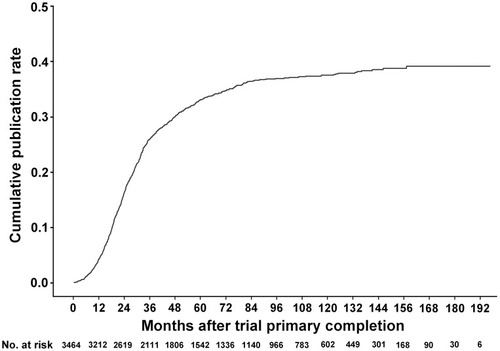
Figure 4 Cumulative publication rate curve since trial primary completion. Kaplan–Meier analysis was used. Trials with a “completed” status were included in the analysis.