Figures & data
Figure 1 Global passenger car sales.
Note: Data from International Energy AgencyCitation16, Weiss et alCitation134, GAS2Citation135, OICACitation136.
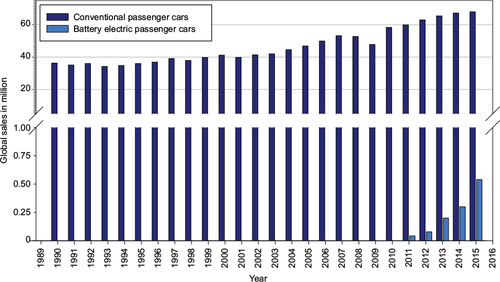
Figure 2 Stylized life-cycle assessment of BEVs.
Note: Data from ISO.Citation11
Abbreviation: BEVs, battery electric vehicles.
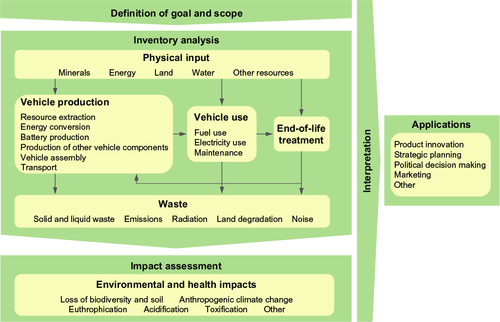
Figure 3 Number of articles and scientific reports published between 2011 and 2015 on the environmental impacts of BEVs.
Abbreviation: BEVs, battery electric vehicles.
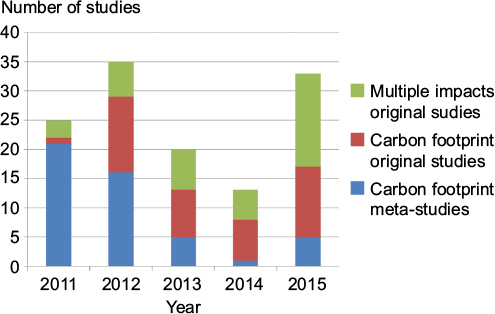
Figure 4 Simplified carbon footprint comparison of BEVs and ICEVs considering the use phase and the impacts of battery production only.
Notes: ICEV: the minimum value (122 g CO2/km; CO2 emissions considered here only instead of CO2 equiv, resulting in deviations of just 1–2%)Citation15 is based on the assumption that on-road emissions are 41% higher than the certified 73 g CO2/km for the Toyota Prius IV62 and that carbon losses along the fuel production and distribution chain reach on average 18%.Citation15 The maximum value (354 g CO2/km) assumes 13 L/100 km fuel consumptionCitation50 and likewise a supply chain losses of 18%. CtL: the use-phase carbon footprint can reach up to 787 g CO2/km when based on CtL fuel.Citation112 BEV: electricity consumption at charging point is 19–27 kWh/100 km; “BEV high coal” scenario is based on 1002 g CO2 equiv/kWh in China.Citation54 “BEV medium carbon” scenario is based on the EU27 electricity carbon footprint of 540 g CO2/kWh in 2009;Citation40 “BEV EU27 2030” scenario assumes a carbon footprint of 211 g CO2 equiv/kWh (prediction);Citation60 “BEV low carbon” scenario assumes a carbon footprint of 150 g CO2 equiv/kWh (rounded from Helmers et alCitation44). We add 18.3 g CO2 equiv/km22 to each BEV scenario to account for the carbon footprint of the battery.
Abbreviations: BEV, battery electric vehicle; CtL, coal-to-liquid; ICEVs, internal combustion engine vehicles; V2G, vehicle-to-grid.
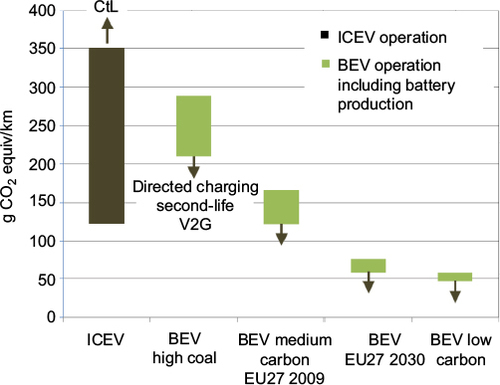
Table 1 Life cycle assessment of impact categories other than carbon footprint on the midpoint level
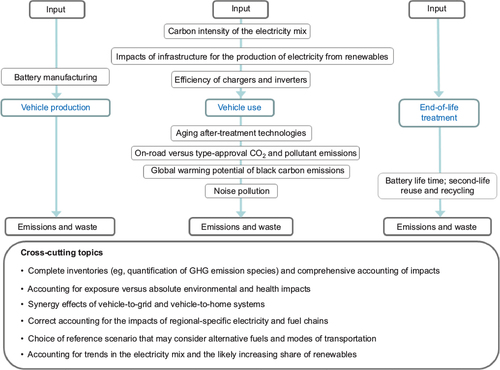
Figure 5 Schematic overview of critical aspects in the comparative life-cycle assessment of BEVs and conventional cars.
Abbreviations: BEVs, battery electric vehicles; GHG, greenhouse gas.