Figures & data
Figure 1 Synthesize procedure of curcumin nanoparticles.
Note: The white arrow shows the Nano-curcumin produced.
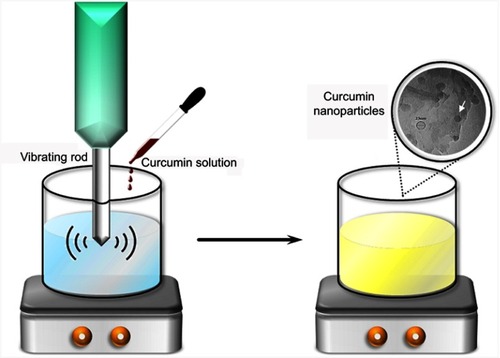
Table 1 DNA sequences used in PCR and real-time RT-PCR
Table 2 Antibiotic susceptibility of the 100 P. aeruginosa isolates by disk diffusion method
Table 3 Antibiotic susceptibility of the 100 P. aeruginosa isolates by Broth microdilution method
Table 4 Phenotypic and genotypic characteristics of P. aeruginosa MDR strains were evaluated in this study
Figure 2 UV-Vis spectrum of curcumin (solid line) and curcumin nanoparticles (dashed line).
Abbreviations: Cur., curcumin; Nanocur., Nano-curcumin.
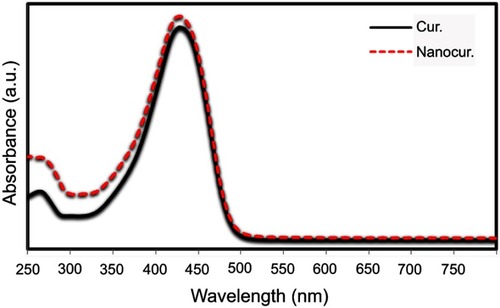
Figure 3 (A) TEM image and (B) dynamic light scattering analysis of the as-prepared curcumin nanoparticles which exhibit very narrow size distribution.
Note: (A) Arrows show synthesized curcumin nanoparticles.
Abbreviation: TEM, transmission electron microscopy.
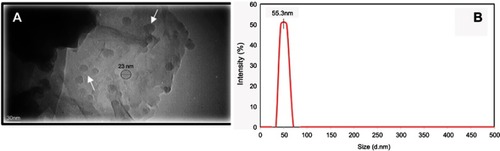
Figure 4 AFM image (A), height distribution (B) and lateral size distribution (C) of the curcumin nanoparticles deposited on freshly cleaved mica substrate.
Abbreviation: AFM, atomic force microscope.
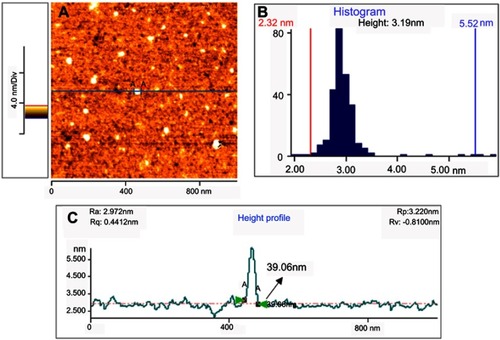
Figure 5 Expression of virulence genes in 5 MDR clinical strains compared to PAO1 (*P<0.05).
Abbreviation: MDR, multi-drug resistant.
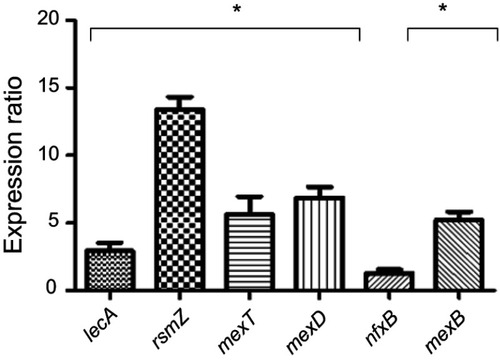
Figure 6 Relative gene expression levels of curcumin and Nano-curcumin-treated PAO1 and 5 MDR clinical strains of P. aeruginosa.
Notes: *P<0.05; **P<0.01; ***P<0.001. (A) and (B) are curcumin-treated MDR strain of P. aeruginosa and PAO1, respectively; (C) and (D) are Nano-curcumin treated MDR strains of P. aeruginosa and PAO1, respectively.
Abbreviations: MDR, mult-drug resistant; P. aeruginosa, Pseudomonas aeruginosa.
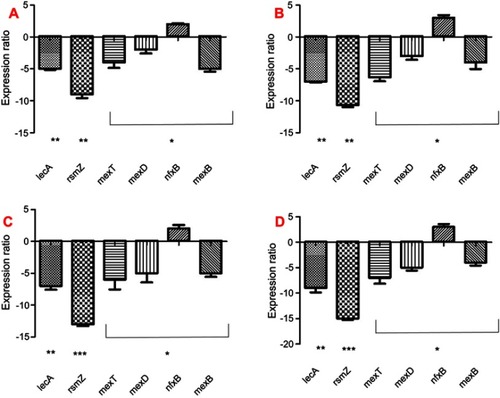
Figure 7 The effects of Nano-curcumin and curcumin on the biofilm of P. aeruginosa MDR strains and PAO1 (*P<0.05).
Abbreviations: MDR, mult-drug resistant; P. aeruginosa, Pseudomonas aeruginosa.
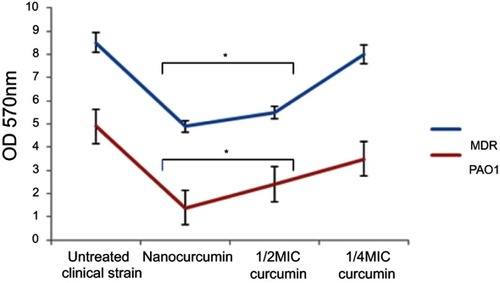
Figure 8 The effect of Nano-curcumin and curcumin on the reduction of pre-formed P. aeruginosa biofilm.
Abbreviation: P. aeruginosa, Pseudomonas aeruginosa.
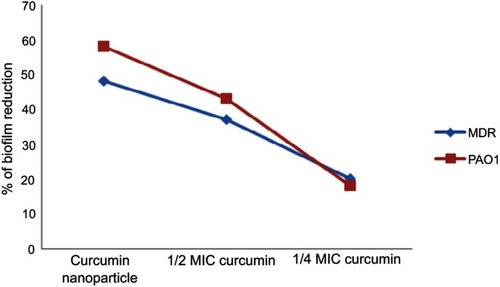
Figure 9 Morphology of the human epithelial cell lines (A549) after incubation with Nano-curcumin for 24 hrs (original magnification, 100×). (A) Control, (B) Nano-curcumin 1,000 µg/mL, (C) Nano-curcumin 200 µg/mL.
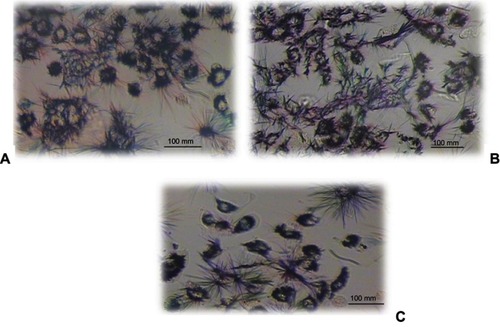
Figure 10 Influence of the different concentrations of Nano-curcumin on the viability of human epithelial cell lines (A549) after 24-hr incubation. The relative cell viability (%) was computed by this formula: [A]test/[A]control ×100. The experiment was performed 2 times in duplicates.
![Figure 10 Influence of the different concentrations of Nano-curcumin on the viability of human epithelial cell lines (A549) after 24-hr incubation. The relative cell viability (%) was computed by this formula: [A]test/[A]control ×100. The experiment was performed 2 times in duplicates.](/cms/asset/6def3b48-2219-4073-aa93-90766537fd42/didr_a_213200_f0010_b.jpg)
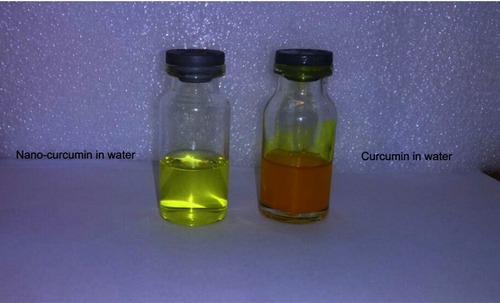
Figure 11 Solubility of Nano-curcumin (left) and curcumin (right) in water.