Figures & data
Figure 1 Annual trends in the number of antibiotic-resistant A. baumannii related publications from 1991 to 2018. The blue line is the number of annual publication. The red line is the cumulative number of publication.
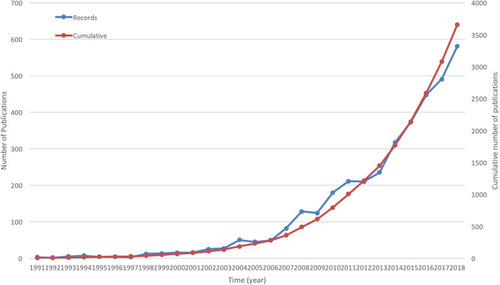
Table 1 Data Type Statistics of Research on Antibiotic-Resistant A. baumannii
Figure 2 The country co-occurrence network of antibiotic-resistant A. baumannii related publications from 1991 to 2019. A node represents a country, and node size represents frequency.
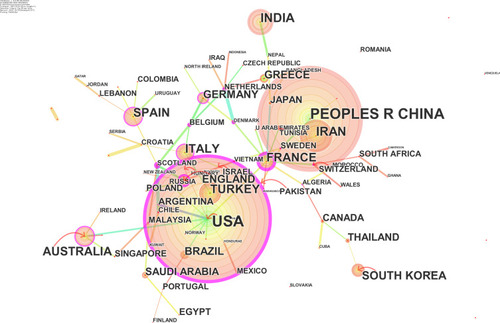
Table 2 Top 10 of Countries and Institutions That Published Antibiotic-Resistant A. baumannii-Related Articles from 1991 to 2019
Figure 3 The institution co-occurrence network of antibiotic-resistant A. baumannii related publications from 1991 to 2019. A node represent an institution, and node size represents frequency.
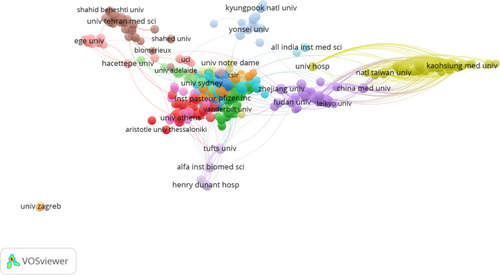
Table 3 Top 10 of Author and Co-Cited Author That Published Antibiotic-Resistant A. baumannii-Related Articles from 1991 to 2019
Figure 4 The author co-occurrence network of antibiotic-resistant A. baumannii related publications from 1991 to 2019. A node represent an institution, and node size represents frequency.
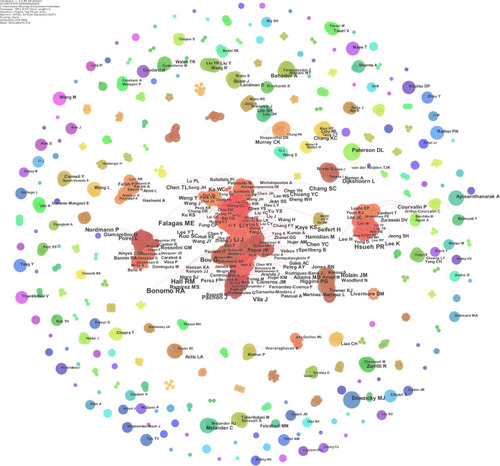
Table 4 Top 10 Journal That Published Antibiotic-Resistant A. baumannii-Related Articles Most from 1991 to 2019
Table 5 Top 5 Co-Cited References Related to Antibiotic-Resistant A. baumannii Research from 1991 to 2019 in Terms of Frequency and in Terms of Centrality
Table 6 Top 5 Cited References Related to Antibiotic-Resistant A. baumannii Research From 1991 to 2019 in Terms of Frequency
Figure 5 The reference co-occurrence network of antibiotic-resistance A. baumannii related publications from 1991 to 2019. A node represent an institution, and node size represents frequency.
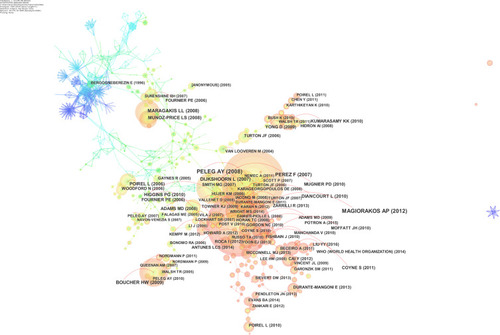
Table 7 Top 10 Keywords Related to Antibiotic-Resistance A. baumannii Research from 1991 to 2019 in Terms of Frequency and in Terms of Centrality
Figure 6 The keywords co-occurrence network of antibiotic-resistant A. baumannii related publications from 1991 to 2019. A node represents an institution, and node size represents frequency.
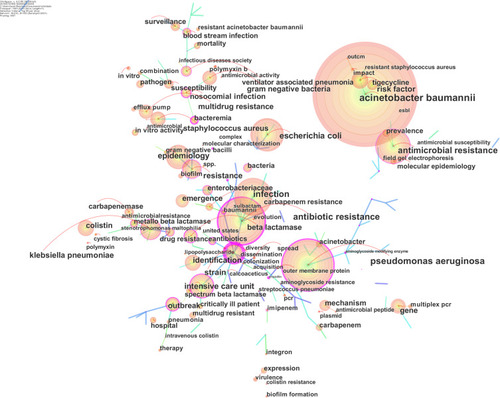
Figure 7 The clusters visualization network of keywords of antibiotic-resistance A. baumannii related publications from 1991 to 2019.
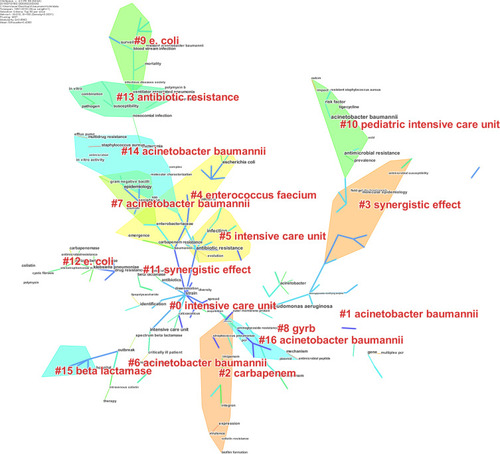
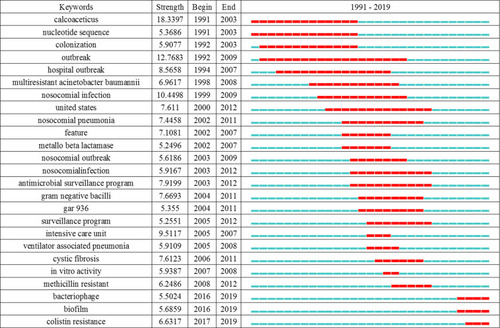
Figure 8 The keywords with the strongest citation bursts of antibiotic-resistant A. baumannii related publications from 1991 to 2019. The time interval is indicated by the green line, and the time interval of burst keywords is highlighted in red, indicating the beginning and end of the time interval of each burst.