Figures & data
Table 1 Demographic Details for Postpartum Women from 2015 to 2020
Figure 1 Pathogenic spectrum and distribution of BSIs during the study period. The distribution and percentages of (A) gram-negative and (B) gram-positive pathogens isolated from blood culture samples in this study.
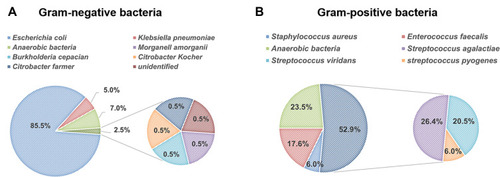
Figure 2 Analysis of the incidence rate of E. coli and anaerobes isolated in BSIs from patients according to cesarean or vaginal delivery due to PROM. Cases of patients infected with E. coli (A) and anaerobic bacteria (B) under cesarean section (yellow) or vaginal delivery (purple) are shown. Cases of patients who underwent cesarean section or vaginal delivery due to PROM are shown.
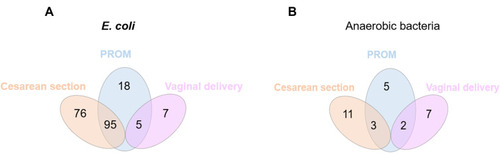
Figure 3 Changes in the pathogenic bacterial distribution in BSI from 2015 to 2020. (A) The overall distribution trend of pathogens isolated in BSIs from postpartum women between 2015 to 2020. (B) The detection of common pathogens in BSIs in recent years.
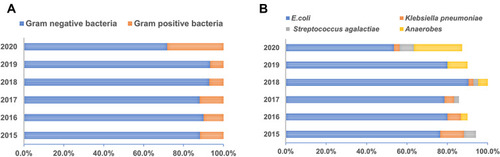
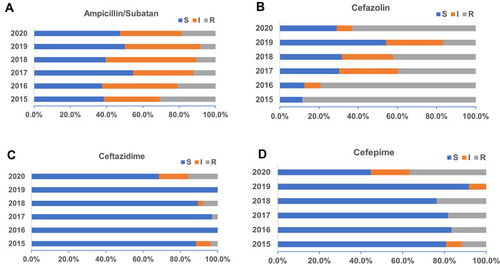
Figure 4 Sensitivity analysis of E. coli to common antibiotics.
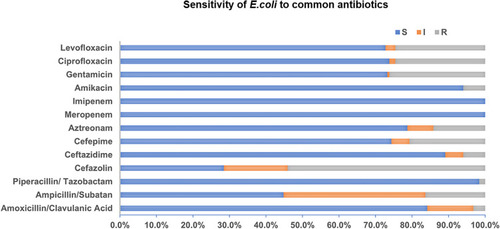
Figure 5 Sensitivity of E. coli to commonly used antibacterial drugs (%). (A) Sensitivity of E. coli against Ampicillin/Subatan during the past 6 years. Sensitivity of E. coli against cephalosporins including (B) Cefazolin, (C) Ceftazidime, and (D) Cefepime.