Figures & data
Table 1 Baseline Characteristics of Gram-Positive Bacterial, Gram-Negative Bacterial and Fungal Infection Groups
Figure 1 Study population flow diagram.
Abbreviations: SLE, Systemic Lupus Erythematosus; PCT, procalcitonin.
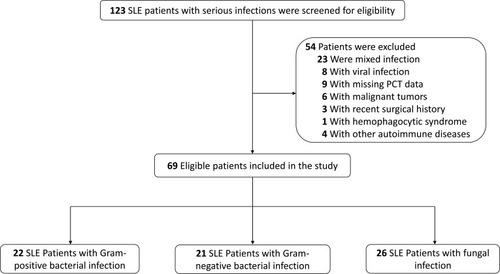
Figure 2 PCT concentrations in patients with different groups.
Notes: (A) The box-plots and Scatter-plots represent serum concentrations of PCT (procalcitonin) in the fungal, bacterial, gram-positive bacterial, and gram-negative bacterial infection patients. *The p-value was calculated using Mann–Whitney nonparametric test to verify differences in PCT between the fungal and other groups. (B) The box-plots and Scatter-plots represent serum concentrations of PCT in the respiratory, abdominal/urinary, skin/soft-tissue and other groups. #The p-value was calculated by Kruskal–Wallis nonparametric test.
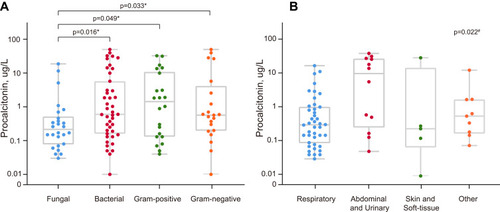
Table 2 Results of the ROC Analysis for Predicting Fungal Infection
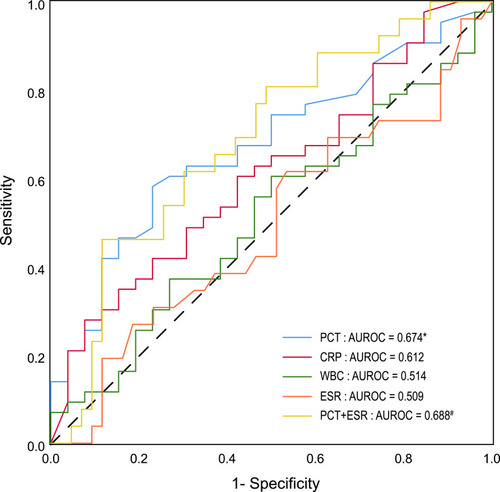
Figure 3 ROC curve and AUROC of fungal infection by PCT and other biomarkers.
Notes: ROC curve shows the sensitivity and specificity for various cutoff values on the PCT, CRP, WBC, ESR and the combination of PCT and ESR. The discriminative ability of the biomarker for the diagnose of fungal infection was expressed as a AUROC. *The AUROC of PCT showed differences compared to CRP, WBC, or ESR (p < 0.001). #The AUROC of PCT+ESR showed no significant differences, as compared to PCT alone (p = 0.693).
Abbreviations: ROC curve, receiver operator characteristic curve; AUROC, area under the receiver operating characteristic curve; PCT, procalcitonin; CRP, C-reactive protein; WBC, white blood cell; ESR, erythrocyte sedimentation rate.