Figures & data
Figure 1 Prevalence and species characteristics of Candida isolates in h-HVS and d-HVS samples. (A and B) represent the prevalence of yeast growth in h-HVS and d-HVS samples from women and dogs, respectively showing symptoms of vulvovaginal candidiasis. (C) A representative image of germ tube indicative of fungal species. Arrows show mother cell (blue), daughter cell (yellow), and germ tube (white). DIC image was taken using a 40X objective at a scale of 10 μm using an upright light microscope (MoticTM, USA). (D) Representative images of the chromogenic display of different strains of Candida on the differential media. Arrows indicate different color variations spanning C. albicans → green; C. tropicalis → metallic blue; C. krusei → pink, fuzzy; C. glabrata → mauve–brown; other species → white to mauve. (E) Some samples have mixed cultures of isolates while some were pure cultures. (F) The species distribution of the isolates is shown, with C. albicans exhibiting the highest prevalence.
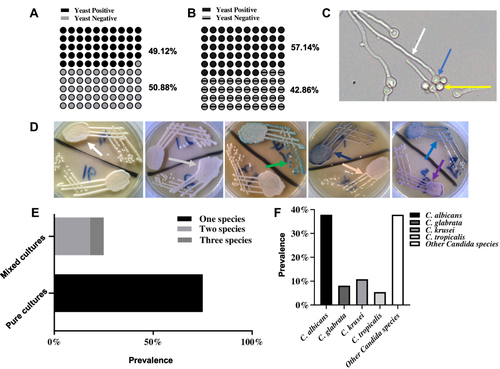
Table 1 Susceptibility of Candida Isolates to 25 μg Fluconazole
Figure 2 Representative images of C. albicans isolates displaying a varying degree of susceptibility to 25 μg fluconazole including (A) SC5314, (B) the most resistant isolate, (C) SSD isolate, (D) the most susceptible isolate, and (E) the isolate from a dog. (F) and (G) shows the fluconazole susceptibility distribution between the Candida species. (H and I) are heatmap images of the comparative analysis between the Candida strains susceptibility to 25 μg fluconazole at 24 h and 48 h using zone of inhibition and MIC, respectively. Student’s t-test analysis shows that there was no significant difference (p > 0.05) between the susceptibility at 24 h and 48 h.
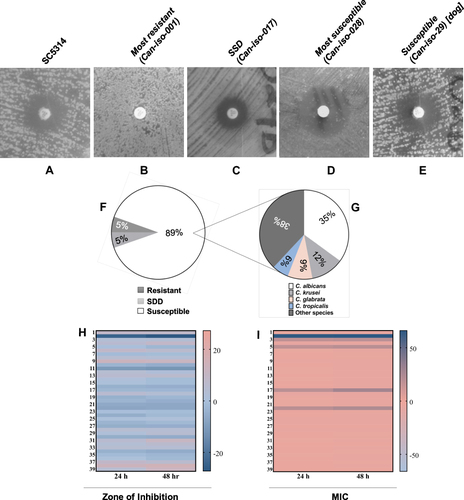
Figure 3 A depiction of the binding poses of two different azole drugs in the CYP51 drug-binding pocket. (A) shows the interaction of posaconazole (yellow) with different active site residues (blue) and prosthetic heme group (brown) of the C. albicans CYP51. (B) shows the interaction of fluconazole (green) with different active site residues (blue) and prosthetic heme group (brown) of the S. cerevisiae CYP51.
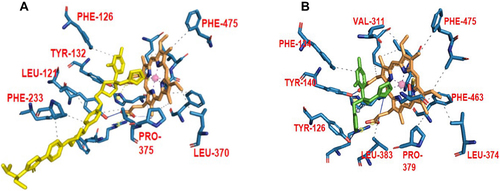
Figure 4 CYP51 nucleotide and amino acid MSA for the wild-type (XM_711668.2) and clinical isolates of C. albicans. (A) Nucleotide MSA between the wild-type (XM_711668.2) and resistant strains (Can–iso–001 and Can–iso–017). (B) Amino acid MSA between the wild-type (XM_711668.2) and the resistant strains. (C) Nucleotide MSA between the wild-type (XM_711668.2) and susceptible strains (Can–iso–028 and Can–iso–dog). (D) Amino acid MSA between the CYP51 of the wild-type and the susceptible strains. (E) Alignment of the amino acid sequences of C. albicans (5FSA) and S. cerevisiae (4WMZ) CYP51. The highlighted residues (LEU–370 and PRO–375 in the C. albicans CYP51) are the amino acid residues of interest and both are equivalent to LEU–374 and PRO–379 respectively in the S. cerevisiae CYP51. (F) Structural alignment of the C. albicans (grey cartoon) and S. cerevisiae (turquoise cartoon) CYP51 3D structures as visualized using the Pymol molecular visualizer. The prosthetic heme molecule of the C. albicans CYP51 is colored in purple while that of the S. cerevisiae is colored in blue. The highlighted regions depict the codons and amino acid residues of interest while the asterisks denote the degree of conservation for within residues.
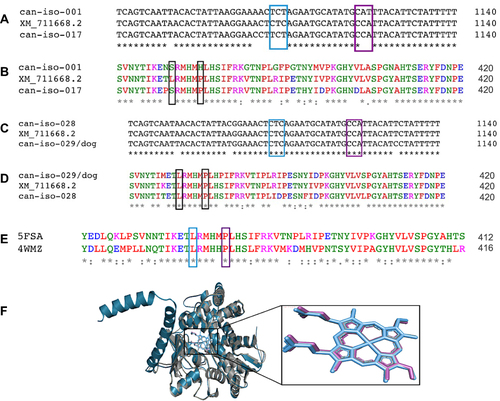
Figure 5 Wild–type and mutant C. albicans CYP51 drug–binding site. (A) depicts the binding orientation of the prosthetic heme (purple) and the two wild-type residues of interest (LEU–370 and PRO–375) in yellow sticks near the drug-binding pocket (Orange surface representation). (B) shows the binding orientation of the prosthetic heme (purple) and the two mutant residues of interest (SER–370 and SER–375) in red sticks near the drug-binding pocket (Orange surface representation).
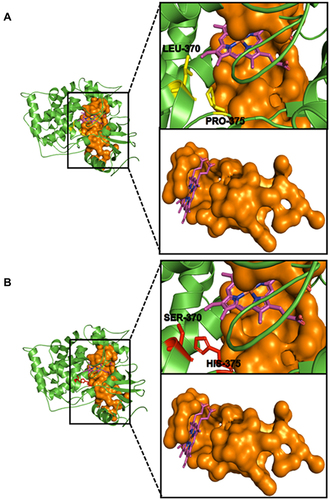
Figure 6 A view of the C. albicans CYP51 residues interacting with the prosthetic heme in the drug–binding pocket of the protein. (A) The wild-type CYP51 shows residues LEU–370 and PRO–375 as part of the heme interacting residues. (B) Mutation in these residues to SER–370 and HIS–375, respectively led to the loss of the hydrophobic interaction with these residues hence, these residues are lost in the interaction profile.
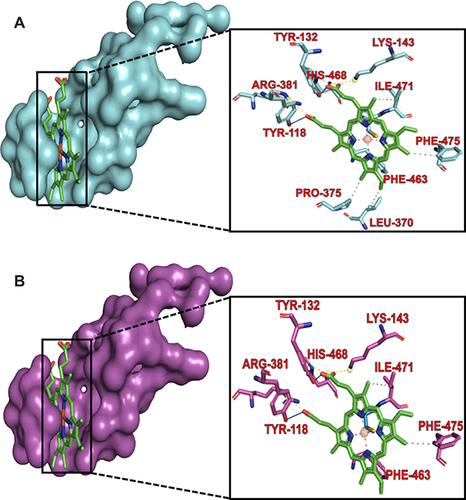
Figure 7 Analysis of the molecular dynamics simulations and trajectory of the wild-type and mutant proteins. (A) plots of the root mean square deviation, (B) root mean square fluctuation, and (C) the radius of gyration for the wild-type and mutant proteins, respectively.
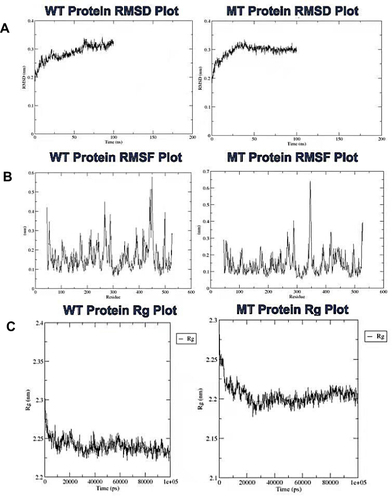
Figure 8 Analysis of the molecular dynamic simulations and trajectory of the wild-type and mutant bound prosthetic heme. (A) Plots of the root mean square deviation, and (B) the intramolecular hydrogen bonds for the wild-type and mutant bound prosthetic heme, respectively.
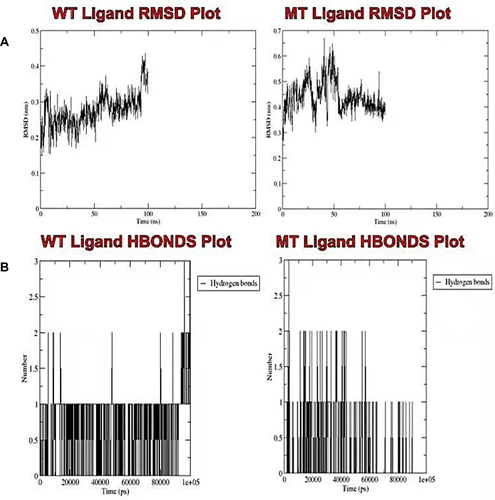
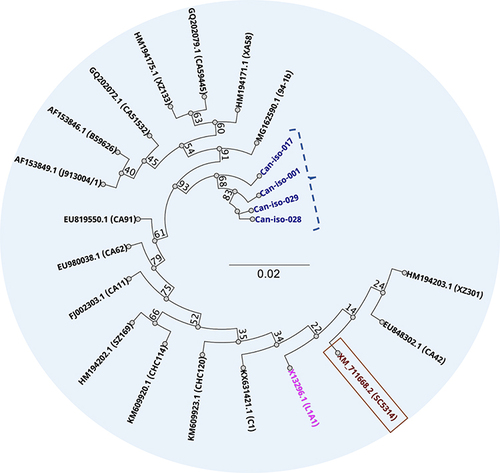
Figure 9 Unrooted phylogenetic relationship between the ERG11 genes of the 4 Candida isolates sequenced in this study (in purple), and 17 pre-selected nucleotide sequences from GenBank repository. Wild–type is in brown, and ERG16 in pink.