Figures & data

Figure 1 Estimated versus measured blood glucose of trained subjects (hollow red circles; n = 18) and control (untrained) subjects (hollow black circles; n = 42) reporting to be hungry at the final laboratory investigative session.
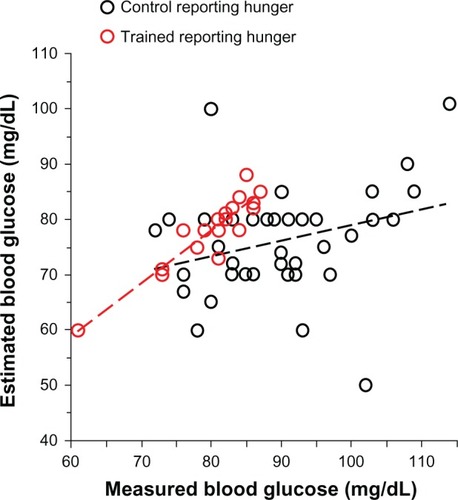
Figure 2 Estimated versus measured blood glucose of trained subjects with measured blood glucose < 87 mg/dL at the final session.
Abbreviation: EHS, Empty Hollow Sensation.
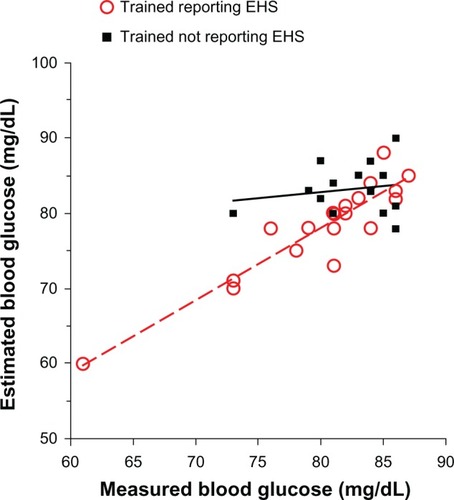
Figure 3 Difference of mean preprandial BG after training versus BG at recruitment for each trained subject.
Copyright © 2011, Dove Medical Press Ltd. Reproduced with permission from Ciampolini M, Sifone M. Differences in maintenance of mean blood glucose (BG) and their association with response to “recognizing hunger.” Int J Gen Med. 2011; 4:403–412.Citation21
Abbreviations: BG, blood glucose; HBG, high blood glucose; LBG, low blood glucose.
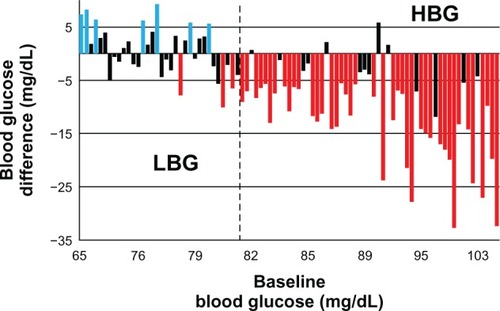
Table 1 Effects of heavy outdoor workTable Footnote† in 27 trained subjects who remained with high blood glucose at investigation end