Figures & data
Table 1 Formulation of various nanoparticles
Table 2 Composition of NPs used to optimize the densities of iRGD–PEG–PLGA
Table 3 Composition of NPs used to optimize the densities of TAT–PEG–PLGA
Figure 1 HPLC results for iRGD or TAT coupling to Mal–PEG–PLGA.
Notes: (A) Before the coupling step, free iRGD in the mixture of Mal–PEG–PLGA and iRGD showed a peak with a retention time at ~10.8 min. (B) After the coupling step, free iRGD in the mixture of Mal–PEG–PLGA and iRGD was incorporated onto the Mal–PEG–PLGA and the peak for iRGD was not obvious. (C) Before the coupling step, free TAT in the mixture of Mal–PEG–PLGA and TAT showed a peak with a retention time at ~20.08 min. (D) After the coupling step, free TAT in the mixture of Mal–PEG–PLGA and TAT was incorporated onto the Mal–PEG–PLGA and the peak for TAT was not obvious.
Abbreviations: HPLC, high-performance liquid chromatography; iRGD, internalizing arginine-glycine-aspartic acid; Mal–PEG–PLGA, maleimide-poly(ethylene glycol)-poly(lactic-co-glycolic acid); TAT, transactivated transcription.
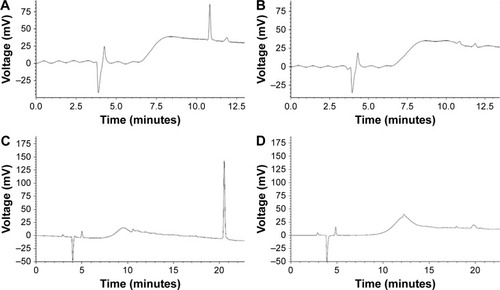
Figure 2 1H NMR spectra of iRGD (A), TAT (B), Mal–PEG–PLGA (C), iRGD–PEG–PLGA (D), and TAT–PEG–PLGA (E). iRGD–PEG–PLGA, iRGD-modified PEG–PLGA; TAT–PEG–PLGA, TAT-modified PEG–PLGA.
Abbreviations: iRGD, internalizing arginine-glycine-aspartic acid; Mal–PEG–PLGA, maleimide-poly(ethylene glycol)-poly(lactic-co-glycolic acid); NMR, nuclear magnetic resonance; PEG, poly(ethylene glycol); PLGA, poly(lactic-co-glycolic acid); TAT, transactivated transcription.
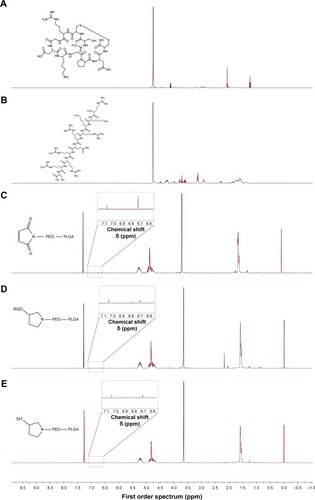
Table 4 Characterization of NPs
Figure 3 DLS image (A) and TEM (B) characterization of iRGD and TAT dual-modified nanoparticles.
Abbreviations: DLS, dynamic light scattering; iRGD, internalizing arginine-glycine-aspartic acid; TAT, transactivated transcription; TEM, transmission electron microscope.
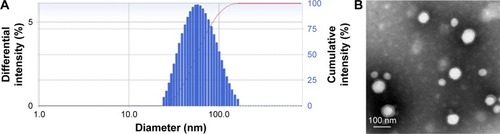
Table 5 Characterization of NPs with different densities of iRGD–PEG–PLGA
Figure 4 Fluorescence microscopy images of the cellular uptake of NPs with 5, 20, and 40% iRGD–PEG–PLGA in HUVECs.
Notes: 5% iRGD–TAT-Nile red-NP, iRGD and TAT dual-modified NPs labeled with Nile red with 5% iRGD–PEG–PLGA; 20% iRGD–TAT-Nile red-NP, iRGD and TAT dual-modified NPs labeled with Nile red with 20% iRGD–PEG–PLGA; 40% iRGD–TAT-Nile red-NP, iRGD and TAT dual-modified NPs labeled with Nile red with 40% iRGD–PEG–PLGA.
Abbreviations: HUVECs, human umbilical vein endothelial cells; iRGD, internalizing arginine-glycine-aspartic acid; NP, nanoparticle; PEG, poly(ethylene glycol); PLGA, poly(lactic-co-glycolic acid); TAT, transactivated transcription.
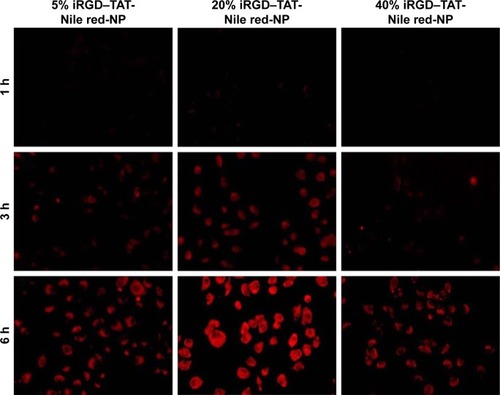
Table 6 Characterization of NPs with different densities of TAT–PEG–PLGA
Figure 5 Fluorescence microscopy images of the cellular uptake of NPs with 5, 20, and 40% TAT–PEG–PLGA in HUVECs.
Notes: iRGD–5% TAT-Nile red-NP, iRGD and TAT dual-modified NPs labeled with Nile red with 5% TAT–PEG–PLGA; iRGD–20% TAT-Nile red-NP, iRGD and TAT dual-modified NPs labeled with Nile red with 20% TAT–PEG–PLGA; iRGD–40% TAT-Nile red-NP, iRGD and TAT dual-modified NPs labeled with Nile red with 40% TAT–PEG–PLGA.
Abbreviations: HUVECs, human umbilical vein endothelial cells; iRGD, internalizing arginine-glycine-aspartic acid; NP, nanoparticle; PEG, poly(ethylene glycol); PLGA, poly(lactic-co-glycolic acid); TAT, transactivated transcription.
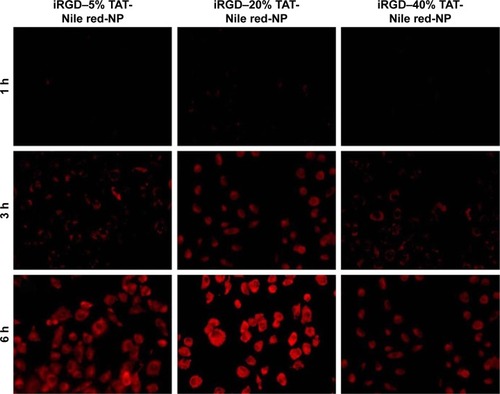
Figure 6 Cellular uptake images for different NPs after treating HUVECs at 1, 3, and 6 h.
Notes: The blue fluorescence and the red fluorescence belong to Hoechst 33342 and NPs labeled with Nile red, respectively. mPEG–PLGA-Nile red-NP, mPEG–PLGA NPs labeled with Nile red; iRGD-Nile red-NP, iRGD-modified NPs labeled with Nile red; TAT-Nile red-NP, TAT-modified NPs labeled with Nile red; iRGD–TAT-Nile red-NP, iRGD and TAT dual-modified NPs labeled with Nile red.
Abbreviations: HUVECs, human umbilical vein endothelial cells; iRGD, internalizing arginine-glycine-aspartic acid; mPEG, methoxy-poly(ethylene glycol); NP, nanoparticle; PLGA, poly(lactic-co-glycolic acid); TAT, transactivated transcription.
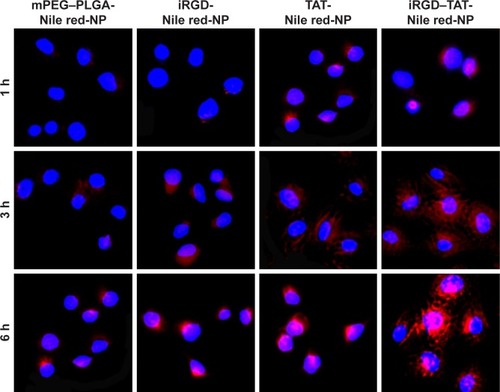
Figure 7 Permeability coefficients of mPEG–PLGA-coumarin-6-NP, iRGD-coumarin-6-NP, TAT-coumarin-6-NP, and iRGD–TAT-coumarin-6-NP.
Notes: Each data point represents the mean ± SD (n=3) of four determinations. **Significant differences from the control with P<0.01. mPEG–PLGA-coumarin-6-NP, mPEG–PLGA NPs labeled with coumarin-6; iRGD-coumarin-6-NP, iRGD-modified NPs labeled with coumarin-6; TAT-coumarin-6-NP, TAT-modified NPs labeled with coumarin-6; iRGD–TAT-coumarin-6-NP, iRGD and TAT dual-modified NPs labeled with coumarin-6.
Abbreviations: iRGD, internalizing arginine-glycine-aspartic acid; mPEG, methoxy-poly(ethylene glycol); NPs, nanoparticles; Papp, apparent permeability; PLGA, poly(lactic- co-glycolic acid); SD, standard deviation; TAT, transactivated transcription.
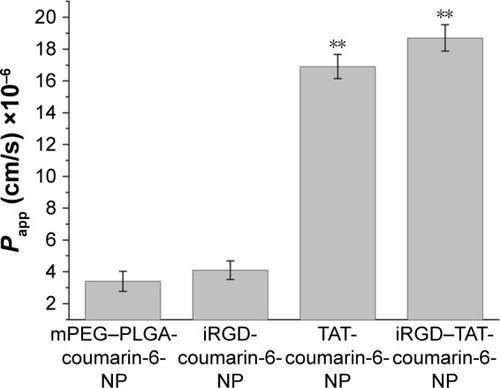
Figure 8 Fundus fluorescein angiography images of the CNV.
Notes: (A) Normal structure of rat eye by intraperitoneal injection of sodium fluorescein before photocoagulation; (B) 7 days after photocoagulation; (C) 14 days after photocoagulation; and (D) 21 days after photocoagulation.
Abbreviation: CNV, choroidal neovascularization.
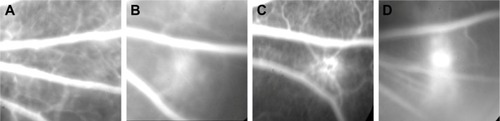
Figure 9 Optical coherence tomography images of the CNV.
Notes: (A) Normal structure of the retina and the choriocapillaries of rats before photocoagulation; (B) 7 days after photocoagulation; (C) 14 days after photocoagulation; and (D) 21 days after photocoagulation.
Abbreviation: CNV, choroidal neovascularization.
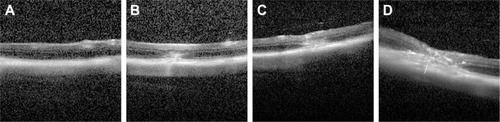
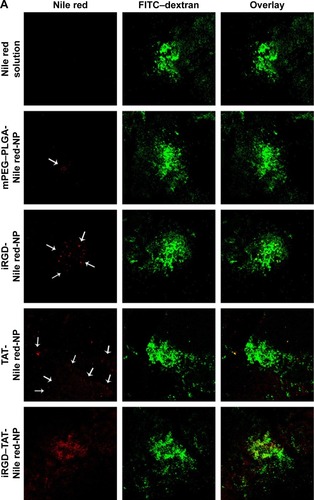
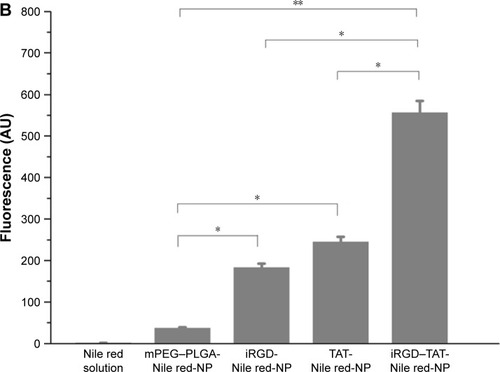
Figure 10 Choroid-sclera flat mounts of laser-treated eyes after eyedrop NP administration.
Notes: (A) Confocal microscope images of posterior segment flat mounts of laser-treated eyes after eyedrop NP administration. The flat mounts were subsequently scanned using a ×10 objective and two channels in multitrack mode: red (NPs containing Nile red as a tracking dye) and green (FITC–dextran accumulation in the CNV). The white arrows indicate the NPs labeled with Nile red. (B) Red fluorescence intensity was measured by FV10-ASW 2.1 Viewer software. *Statistical significance (P<0.05). **Statistical significance (P<0.01). Values represent the mean ± SD (n=3). mPEG–PLGA-Nile red-NP, mPEG–PLGA NPs labeled with Nile red; iRGD-Nile red-NP, iRGD-modified NPs labeled with Nile red; TAT-Nile red-NP, TAT-modified NPs labeled with Nile red; iRGD–TAT-Nile red-NP, iRGD and TAT dual-modified NPs labeled with Nile red.
Abbreviations: CNV, choroidal neovascularization; FITC, fluorescein isothiocyanate; iRGD, internalizing arginine-glycine-aspartic acid; mPEG, methoxy-poly(ethylene glycol); NP, nanoparticle; PLGA, poly(lactic-co-glycolic acid); SD, standard deviation; TAT, transactivated transcription.