Figures & data
Table 1 Primers used for quantitative real time reverse transcription polymerase chain reaction for the analysis of apoptotic, and anti-apoptotic, gene expression
Figure 1 Synthesis and characterization of PdNPs.
Notes: (A) Ultraviolet-visible spectra of PdNPs (blue) and PdCl2 (red). (B) X-ray diffraction pattern of PdNPs. (C) Fourier-transform infrared spectra of PdNPs. (D) Size distribution analysis of PdNPs by dynamic light scattering. (E) TEM images of PdNPs, (F) Size distributions based on TEM images of PdNPs, ranging from 10 nm to 60 nm.
Abbreviations: PdNPs, palladium nanoparticles; PdCl2, palladium(II) chloride; TEM, transmission electron microscopy.
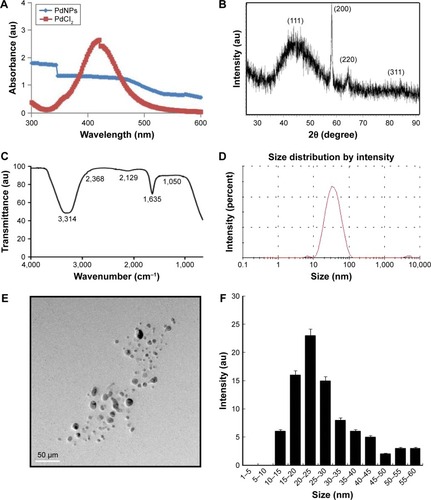
Figure 2 Dose-dependent effects of TUB-A and PdNPs on cell viability in MDA-MB-231 human breast cancer cells.
Notes: MDA-MB-231 human breast cancer cells were incubated with various concentrations of (A) TUB-A (2–20 μM) and (B) PdNPs (2–20 μM) for 24 h. Cell viability was measured by WST-8 assay. The results are expressed as mean ± standard deviation of three separate experiments. The treated groups showed statistically significant differences from the control group, as determined by Student’s t-test (*P<0.05).
Abbreviations: TUB-A, tubastatin-A; PdNPs, palladium nanoparticles.
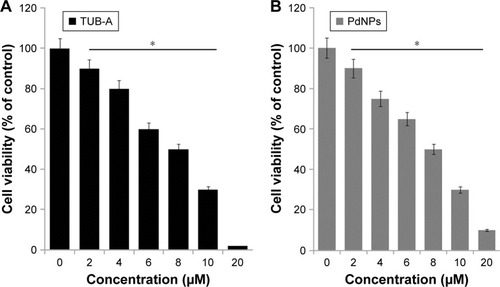
Figure 3 Effects of increasing concentrations of TUB-A or PdNPs on MDA-MB-231 human breast cancer cells viability.
Notes: Human breast cancer cells were coincubated with (A) increasing concentrations of TUB-A (4–10 μM) with 4 μM PdNPs or (B) increasing concentrations of PdNPs (4–10 μM) with 4 μM TUB-A. The results are expressed as mean ± standard deviation of three separate experiments. The treated groups showed statistically significant differences from the control group, as determined by the Student’s t-test (*P<0.05).
Abbreviations: Con, control; TUB-A, tubastatin-A; PdNPs, palladium nanoparticles.
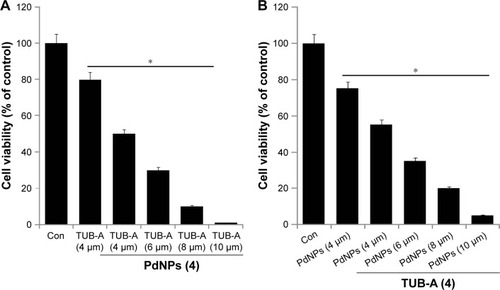
Figure 4 Effects of combined TUB-A and PdNPs treatment on cell viability and HDAC activity in MDA-MB-231 human breast cancer cells.
Notes: Human breast cancer cells were incubated with TUB-A (4 μM) and PdNPs (4 μM) or a combination of both (at 4 μM each) for 24 h. (A) Measurement of cell viability by WST-8 assay. (B) Measurement of HDAC activity. The results are expressed as mean ± standard deviation of three separate experiments. The treated groups showed statistically significant differences from the control group, as determined by Student’s t-test (*P<0.05).
Abbreviations: Con, control; TUB-A, tubastatin-A; PdNPs, palladium nanoparticles; HDAC, histone deacetylase.
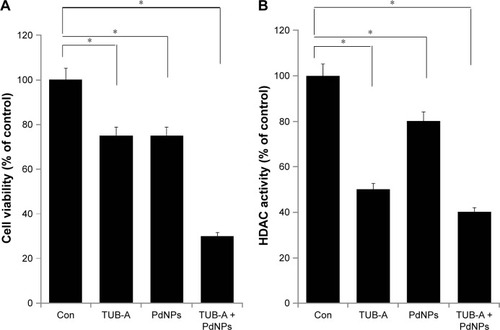
Figure 5 Effects of TUB-A or PdNPs alone or in combination on cell morphology of MDA-MB-231 human breast cancer cells.
Notes: Human breast cancer cells were incubated with TUB-A (4 μM) or PdNPs (4 μM) or a combination of both (at 4 μM each) for 24 h. Red arrows indicate that the detachment of cells from the surface. The treated cells were photographed under a light microscope (200 μm).
Abbreviations: Con, control; TUB-A, tubastatin-A; PdNPs, palladium nanoparticles.
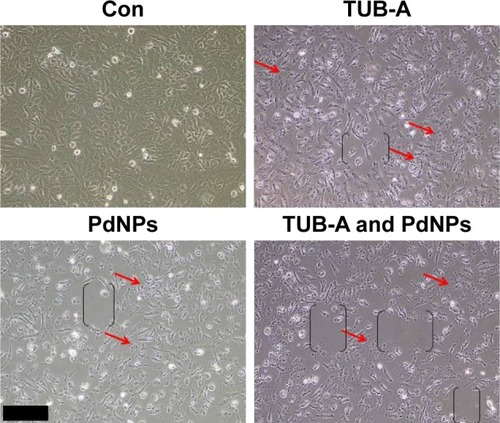
Figure 6 Cytotoxicity effects of TUB-A or PdNPs alone or in combination on MDA-MB-231 human breast cancer cells.
Notes: The cells were treated with TUB-A (4 μM), PdNPs (4 μM), or a combination of both (at 4 μM each) for 24 h. (A) Lactate dehydrogenase (LDH) activity was measured at 490 nm, using LDH cytotoxicity kit (Sigma-Aldrich, St Louis, MO, USA). (B) Reactive oxygen species (ROS) was measured (as the relative fluorescence of 2′,7′-dichlorofluorescein) with a spectrofluorometer. The results are expressed as mean ± standard deviation of three separate experiments. The treated groups showed statistically significant differences from the control group, as determined by Student’s t-test (*P<0.05).
Abbreviations: Con, control; TUB-A, tubastatin-A; PdNPs, palladium nanoparticles.
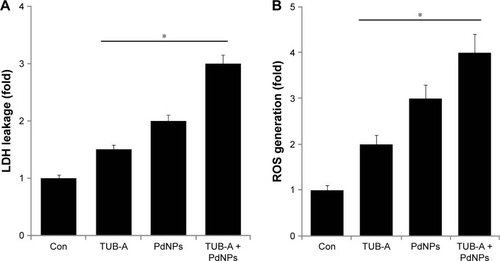
Figure 7 Effects of TUB-A, PdNPs, or a combination of both on oxidative stress markers in MDA-MB-231 human breast cancer cells.
Notes: (A) The cells were treated with TUB-A (4 μM), PdNPs (4 μM), or a combination of both (at 4 μM each) for 24 h. After incubation, the cells were harvested, washed twice with ice-cold PBS, and then disrupted by ultrasonication for 5 min on ice. The concentration of malondialdehyde (MDA) was expressed as nanomole per milligram of protein. (B) The concentration of glutathione (GSH) was expressed as milligram per gram of protein. (C) The specific activity of superoxide dismutase (SOD) was expressed as unit per milligram of protein. (D) The specific activity of catalase (CAT) was expressed as unit per milligram of protein. The results are expressed as mean ± standard deviation of three independent experiments. The treated cells showed statistically significant differences from the untreated cells, as determined by the Student’s t-test (*P<0.05).
Abbreviations: Con, control; TUB-A, tubastatin-A; PdNPs, palladium nanoparticles.
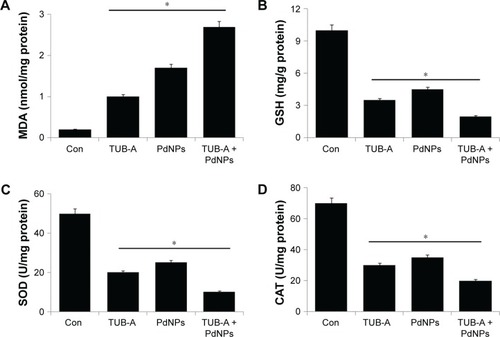
Figure 8 Effects of TUB-A, PdNPs, or a combination of both on the mitochondrial membrane potential and caspase-3 activity.
Notes: The cells were treated with TUB-A (4 μM), PdNPs (4 μM), or a combination of both (at 4 μM each) for 24 h. (A) Determination of ΔΨm (ratio of JC-1 aggregate to monomer) in treated breast cancer cells. (B) Cells treated with TUB-A (4 μM), PdNPs (4 μM), or a combination of both (at 4 μM each) for 24 h, with and without caspase inhibitor. The concentration of P-nitroanilide released from the substrate was calculated from the absorbance at 405 nm. The results are expressed as mean ± standard deviation of three separate experiments. The treated groups showed statistically significant differences from the control group, as determined by Student’s t-test (*P<0.05).
Abbreviations: Con, control; TUB-A, tubastatin-A; PdNPs, palladium nanoparticles.
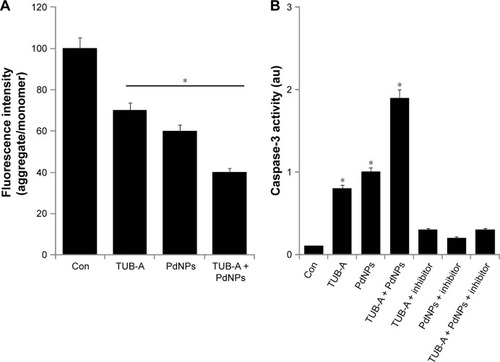
Figure 9 Effects of TUB-A, PdNPs, or a combination of both on apoptosis.
Notes: (A) The cells were treated with TUB-A (4 μM), PdNPs (4 μM), or a combination of both (at 4 μM each) for 24 h. Apoptosis was assessed by TUNEL assay; the nuclei were counterstained with DAPI. Representative images show apoptotic (fragmented) DNA (red stained) and the corresponding cell nuclei (blue stained). (B) The percentage of apoptosis was calculated in cells treated with TUB-A (4 μM), PdNPs (4 μM), or a combination of both (at 4 μM each) for 24 h using TUNEL. *P<0.05.
Abbreviations: Con, control; TUB-A, tubastatin-A; PdNPs, palladium nanoparticles; TUNEL, terminal deoxynucleotidyl transferase dUTP nick end labeling.
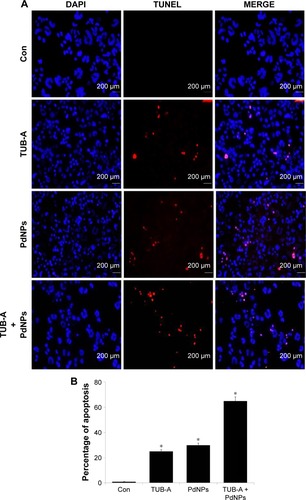
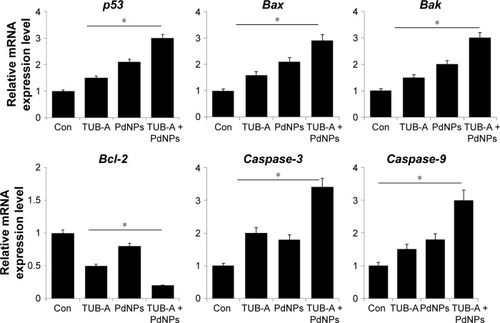
Figure 10 Effect of combined TUB-A and PdNPs treatment on the expression of apoptotic genes.
Notes: The cells were treated with TUB-A (4 μM), PdNPs (4 μM), or a combination of both (at 4 μM each) for 24 h, and then the relative expression levels of pro-apoptotic and anti-apoptotic genes were analyzed by qRT-PCR. The results are expressed as mean ± standard deviation of three separate experiments. The treatment groups showed statistically significant differences from the control group, as determined by Student’s t-test (*P<0.05).
Abbreviations: Con, control; TUB-A, tubastatin-A; PdNPs, palladium nanoparticles.