Figures & data
Table 1 Concentration of magnetic Fe3O4 nanoparticles in bone marrow of mice (n = 6 ± standard deviation)
Figure 1 Image of magnetic nanoparticles of Fe3O4 under transmission electron microscope. Bar = 20 nm (40,000×).
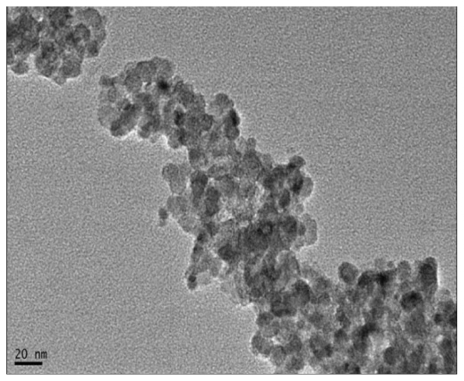
Figure 2 Concentration of Fe3O4 MNPs in peripheral blood of mice (n = 6).
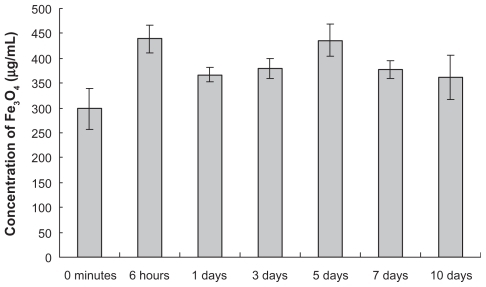
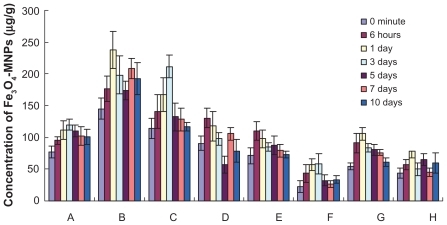
Figure 3 The concentrations of Fe3O4 MNPs in tissues of mice (n = 6). A heart, B liver, C spleen, D lungs, E kidneys, F brain, G stomach, and H small intestine.