Figures & data
Table 1 Relative relationship between ZnO NPs and ZnCl2 at different concentrations
Table 2 Primers used for polymerase chain reaction
Table 3 Characterization of ZnO NPs
Figure 1 Characterization of ZnO NPs.
Notes: ZnO NP morphology and size were detected using TEM (A). DLS (B) was used to determine NP distribution in an aqueous solution. (C) Zinc concentrations in supernatants of ZnO NP suspensions at various concentrations (0, 5, 10, 25, 50, 75, and 100 μg/mL). Scale bar =50 nm.
Abbreviations: DLS, dynamic light scattering; NPs, nanoparticles; TEM, transmission electron microscopy.
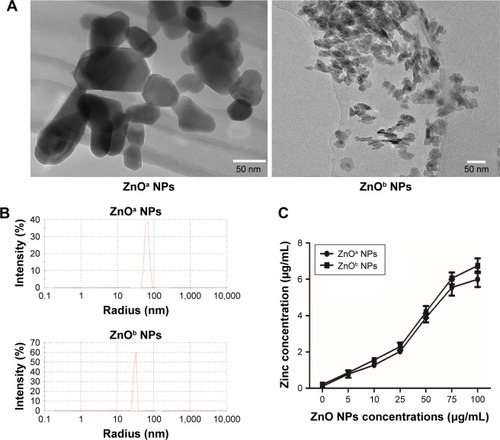
Figure 2 Trans-retinoic acid-induced SHSY5Y-cell differentiation. Scale bar =250 μm. Magnification ×200.
Notes: SHSY5Y cells were differentiated using trans-retinoic acid. Cell-morphology changes were observed at 0, 3, 6, 9, 12, and 15 days.
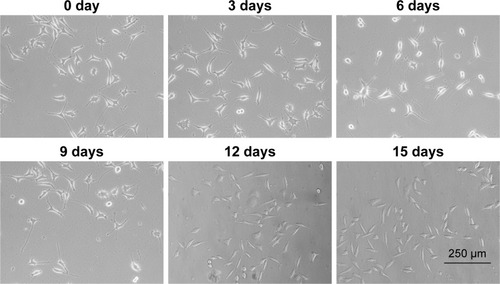
Figure 3 Two types of ZnO NP- and ZnCl2-induced toxic effects in the SHSY5Y cells.
Notes: SHSY5Y cells were treated with ZnO NPs at concentrations of 0, 5, 10, 20, 40, 60, 80, and 100 μg/mL and ZnCl2 at concentrations of 0, 61.4, 122.9, 245.7, 491.5, 737.2, 982.9, and 1,228.7 μM for 2, 6, 12, and 24 hours, and then cell viability was detected via CCK-8 assay. (A) ZnOa NP-induced SHSY5Y cell-viability changes. (B) ZnOb NP-induced SHSY5Y cell-viability changes. (C) ZnCl2-induced SHSY5Y cell-viability changes. Results shown as means ± SEM. *P<0.05; **P<0.01; ***P<0.001.
Abbreviation: NPs, nanoparticles.
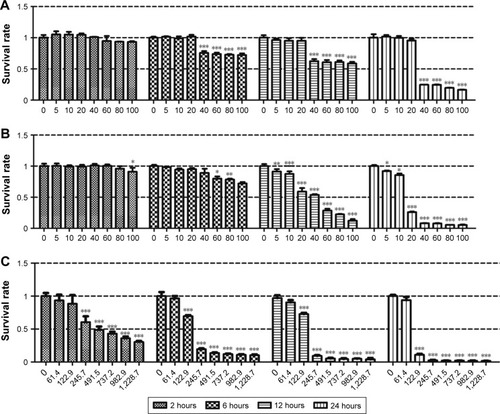
Figure 4 Confocal microscopy investigation of cellular distribution of lysosomes and zinc ions in SHSY5Y cells after the two ZnO NP treatments.
Notes: After SHSY5Y cells had been treated with ZnOa NPs (A) and ZnOb NPs (B) at a concentration of 50 μg/mL for 1, 3, and 5 hours, the cells were loaded with FluoZin-3 (green), LysoTracker (red), and Hoechst 33342 (blue). We observed almost no zinc-ion fluorescence in the control group, but significant zinc ions (green) were observed within 1 hour after ZnO NP treatment and a slight increase in the zinc fluorescence (green) was observed in a time-dependent manner. Treatment with ZnOb NPs exhibited higher fluorescence values than treatment with ZnOa NPs at 1 hour. Moreover, significant overlaps (yellow) between the cellular zinc ions and lysosomes were observed at all time points. Scale bar =50 μm. Magnification ×600.
Abbreviation: NP, nanoparticle.
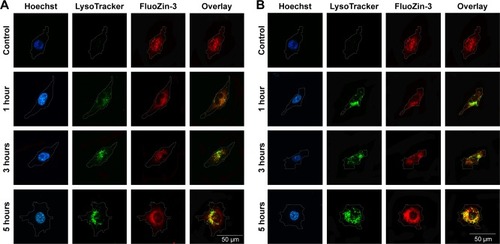
Figure 5 NAC inhibition effects on ZnO NP-induced cytotoxicity, ZnO NP-induced ROS generation, and oxidative stress-related gene changes.
Notes: (A) SHSY5Y cells were treated with ZnOa NPs, ZnOb NPs, and ZnCl2 at various concentrations for 24 hours, and NAC (10 mM) was incubated simultaneously. Cell-viability data were obtained using CCK-8 assay. (B) ROS values in SHSY5Y cells after the ZnO NPs (50 μg/mL) and ZnCl2 (4 μg/mL) treatments for 1, 3 and 5 hours. (C) ROS values in SHSY5Y cells after the ZnO NPs (25 μg/mL) and ZnCl2 (2 μg/mL) treatments for 1, 6, 12 and 24 hours. (D) Oxidative stress-related gene changes in SHSY5Y cells after treatment with ZnO NPs and ZnCl2. Results shown as means ± SEM of three independent experiments. *P<0.05; **P<0.01; ***P<0.001.
Abbreviations: NAC, N-acetylcysteine; NP, nanoparticle; ROS, reactive oxygen species.
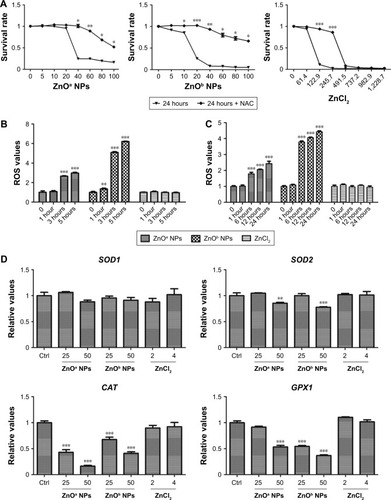
Figure 6 Two types of ZnO NP-induced apoptosis in SHSY5Y cells.
Notes: (A) After SHSY5Y cells had been treated with ZnOa NPs, ZnOb NPs, and ZnCl2 at various concentrations for 5 hours, cell-apoptosis levels were detected. (B) Apoptosis-related changes in gene expression in SHSY5Y cells after treatment with ZnO NPs and ZnCl2. Results shown as means ± SEM of three independent experiments. *P<0.05; **P<0.01; ***P<0.001.
Abbreviations: FITC, fluorescein isothiocyanate; NP, nanoparticle.
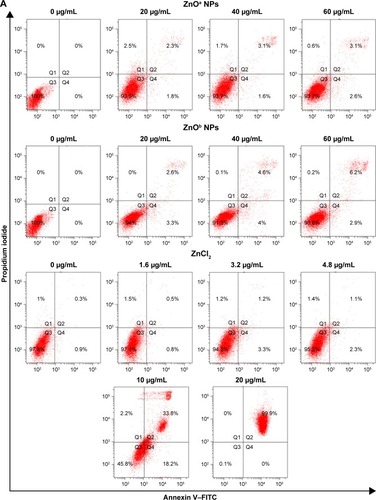
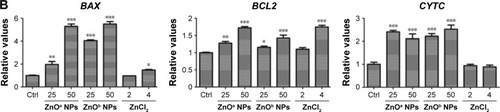
Figure 7 Two types of ZnO NP-induced cytoskeleton changes.
Notes: After SHSY5Y cells had been treated with ZnOa NPs (A) and ZnOb NPs (B) at concentrations of 50 μg/mL for 1, 3, and 5 hours, cytoskeleton changes were assessed based on alterations in actin (red) and tubulin systems (green). Scale bar =50 μm. Magnification ×600.
Abbreviation: NP, nanoparticle.
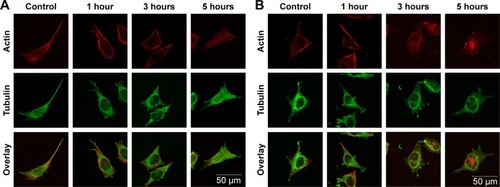
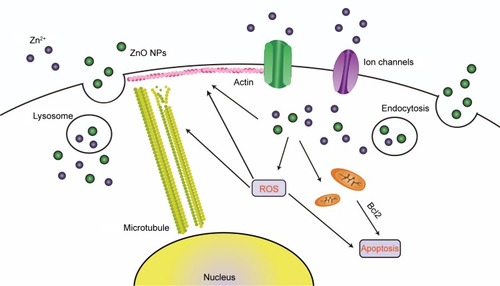
Figure 8 ZnO NP-induced toxic effects in SHSY5Y cells.
Notes: ZnO NPs released zinc ions into the culture medium. Undissolved particles were endocytosed and dissolved into lysosomes due to the acidic environment. ZnO NPs and zinc ions induce ROS generation, resulting in apoptosis and cytoskeleton disruption.
Abbreviations: NP, nanoparticle; ROS, reactive oxygen species.