Figures & data
Figure 1 Chemical structure of TMZ.
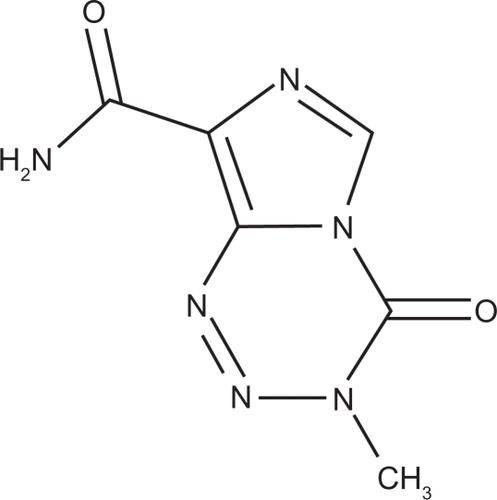
Figure 2 TEM image of TMZ-PBCA-NPs prepared by emulsion polymerization. Bars represent 200 nm A) and 100 nm B).
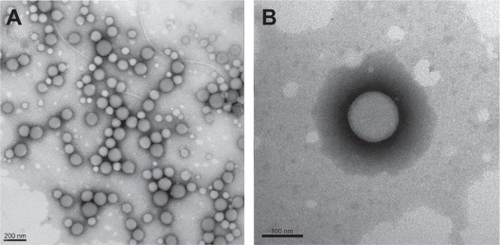
Figure 3 FTIR spectra of TMZ, PBCA-NPs and TMZ-PBCA-NPs.
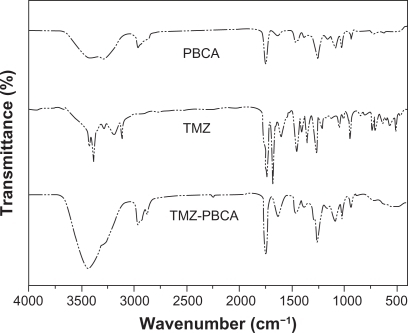
Figure 4 In vitro release profile of TMZ solution, TMZ-PBCA-NPs and TMZ-PBCA-NPs + polysorbate-80.
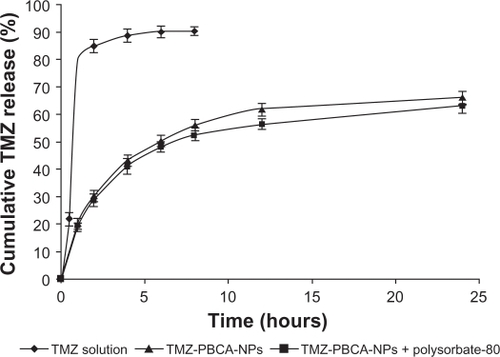
Table 1 The different release model of TMZ-PBCA nanoparticles (I) and TMZ-PBCA nanoparticles + polysorbate-80 II (n = 3)
Table 2 Equations of standard curve of the organs and body distribution (in μg drug per g tissue, μg/g) after intravenous administration of different temozolomide formulations in rats (n=6)
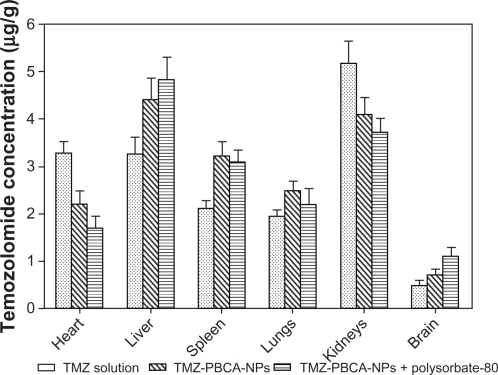
Figure 5 In vivo different tissue distribution of temozolomide concentrations (μg/g) after intravenous injection of TMZ solution, TMZ-PBCA-NPs and TMZ-PBCA-NPs + polysorbate-80.