Figures & data
Figure 1 Phase-contrast microscope images of RT4 and T24 cells treated with either cholera toxin B (CTB) or temperature. Images of RT4 A) and T24 B) cells growing in normal conditions without any treatments (control experiments). Note that intercellular membrane nanotubes (ICNs) are not present between RT4 cells, while a few are present between T24 cells (arrow). Following their growth in normal conditions, the cells are moved to room temperature (RT) for 20 minutes, showing no significant change in the morphology of RT4 cells C), while T24 cells become more separated D). In conjunction with 20 minutes at RT, cells are treated with CTB. Note that in RT4 cells E) no ICNs are observed, while many ICNs (arrow) are present between T24 cells F). Finally, the combination of CTB and temperature incubation at 37°C induces rounding of RT4 cells and their detachment G), while T24 cells demonstrate large numbers of ICNs H).
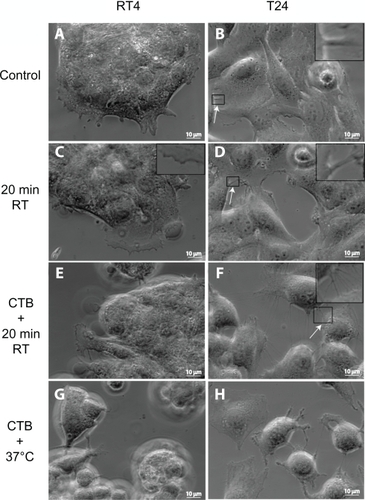
Figure 2 Summary statistics of changes in intercellular membrane nanotube (ICN) densities of treated RT4 and T24 cell lines. The control case was not treated. Note that both 20 minutes at room temperature (RT) and cholera toxin B (CTB) treatments significantly (P < 0.01**) increase the ICN density among T24 cells compared with among RT4 cells.
Note: Data are means ± standard deviation.
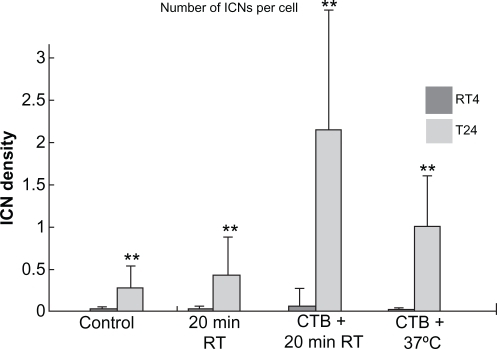
Figure 3 Cell testing for apoptosis using actin filament and nucleus fluorescence markers. To assess whether exposing cells to an ambient temperature or addition of cholera toxin B (CTB) to RT4 and T24 cells induced apoptosis, cells are immunostained for the integrity labeling of actin filaments with phalloidin-fluorescein isothiocyanate, the integrity of the nucleus with vectashield-4′,6-diamidino-2-phenylindole (top insets), and the integrity of the cells using caspase-3 (bottom insets). Note that neither temperature nor CTB treatments trigger apoptosis in RT4 and T24 cells. However, CTB does cause cell damage in some cells, mostly at 37°C.
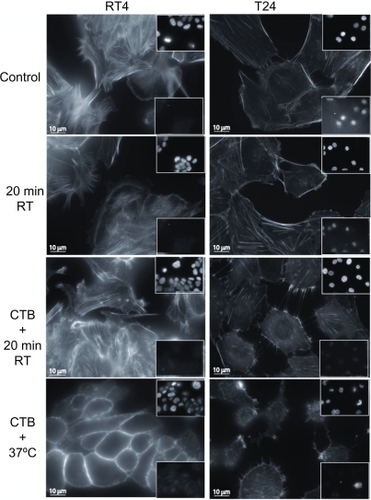
Figure 4 Reversing the induced growth of membrane nanotubes by the addition of anti-cholera toxin B (CTB). The addition of CTB to RT4 A) and T24 B) cells reveals the growth of membrane nanotubes (arrows), as well as membrane lipid rafts (marked by fluorescent CTB–GM1 complexes) at the tips and entire length of membrane nanotubes. Note that some membrane nanotubes (ICNs) make contact with a neighboring T24 cell (b; arrowheads), and the presence of a microvesicular structure at the tip of membrane nanotubes (close up view). The addition of anti-CTB causes the retraction of membrane nanotubes in both RT4 C) and T24 D) cells.
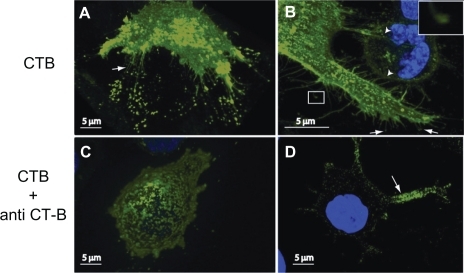
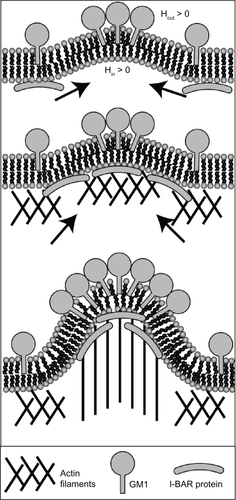
Figure 5 Schematic diagram for the effects of GM1 interaction on membrane curvature. Single GM1 molecules have zero intrinsic (spontaneous) curvature A). Small membrane protrusions are formed due to the interaction between GM1 molecules, where it is assumed that small GM1 aggregates have positive intrinsic curvature B).Citation27,Citation28 Hout and Hin are the mean curvature of the outer and inner cell membrane leaflets, respectively.
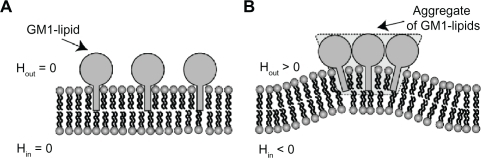
Figure 6 The effects of cholera toxin B (CTB) binding to GM1 molecules on membrane shape and filament densities. A) The schematic model is a nearly straight membrane contour, which describes a segment of an RT4 or T24 cell. Numerical simulations of the flat shape membrane reveal the steady state shapes of membrane amplitudes B) and CTB–GM1 densities C), given that α = 0.013 and H̄ = 5 μm−1 (see Supplementary material for more information). The amplitude h(x) is the value of the membrane deformation. The initial condition is a flat membrane with a random perturbation of small amplitudes (<1%) in the CTB–GM1 density around the uniform value of n0 = 0.1. The intermediate time (in dotted line) is after 400 seconds, and the steady state time (in bold line) is reached within 600 seconds.
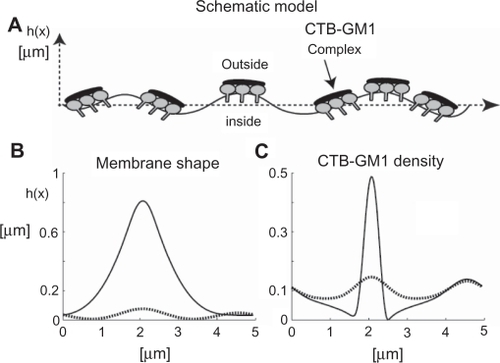
Figure 7 The effects of cholera toxin B (CTB) and prominins on the initial formation and stability of membrane nanotubes. Due to positive spontaneous curvature of GM1 aggregates (see ), such small GM1 aggregates would sense and stabilize small membrane protrusions A). The binding of each CTB molecule to a few GM1 aggregates would lead to the aggregation of CTB–GM1 complexes, thereby driving the coalescence of small membrane protrusions into a large spherical protrusion B). Due to flat shape of CTB it is assumed that bound CTB reduces the spontaneous curvature of GM1 aggregates. The neck region of the membrane protrusion attracts anisotropic membrane nanodomains such as prominins, which facilitate and stabilize the growth of membrane nanotubes C). The addition of anti-CTB (pentameric antibodies) may cross-link (intercalate) CTB units, thereby leading to the formation of stiff microdomains that do not allow the growing of membrane nanotubes D).
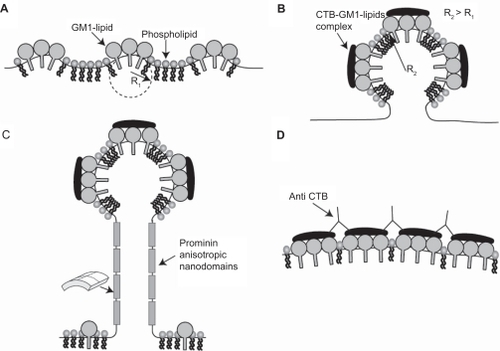
Table 1 Statistical data on the density of ICNs for the different treatments in RT4 and T24 cells
Figure 8 Schematic diagram for the recruitment of I-BAR domain proteins and actin filaments by GM1 aggregates. The positive and negative curvatures at the outer and inner leaflets are induced by a GM1 aggregate. Consequently, I-BAR domain proteins are attracted to the negative curvature at the inner leaflet of a cell membrane. The I-BAR domain proteins would further bend the membrane, while activating the actin nucleation machinery. The nucleation of actin filaments would drive a membrane protrusive growth, elongating the membrane protrusion.