Figures & data
Figure 1 Liver tissue damage caused by cAgNP treatment.
Notes: ALP and LDH levels were used as enzymatic indication of cAgNP liver toxicity (A and B, respectively). The high dose (5 mg/kg) resulted in greater levels of both the enzymes than the low dose (0.5 mg/kg), and the enzyme levels decreased but persisted till the end of the experiment at both the treatment doses. (C and D) show results of the TUNEL assay and statistical analysis of the apoptosis-positive cells scoring in cAgNP-treated liver tissue, respectively, where the high dose (5 mg/kg) resulted in more TUNEL-positive cells than the low dose (0.5 mg/kg), and TUNEL-positive cells decreased at the end. The asterisk indicates a significant difference compared to the control group (P-value <0.05).
Abbreviations: cAgNP, citrate-coated silver nanoparticle; LDH, lactate dehydrogenase.
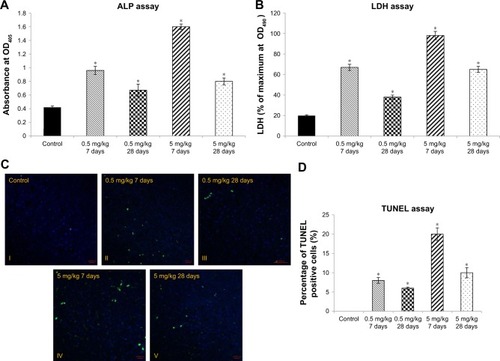
Figure 2 Increased oxidative stress in cAgNP-treated rabbit liver tissue.
Notes: In the malondialdehyde (MDA) assay (A) and the 4-hydroxynonenal (4-HNE) assay (B), levels of oxidative stress markers were increased significantly, and the levels were not recovered after 28 days of cAgNPs treatment. (C) The oxidative DNA damage was increased in cAgNP-treated liver tissue. The high dose (5 mg/kg) resulted in more DNA damage than the low dose (0.5 mg/kg) in the comet assay analysis. (D) Statistical analysis showed that the DNA damage at the high dose was repaired slightly after 28 days. The scale bar is 100 µm. The asterisk indicates a significant difference compared to the control group (P-value <0.05).
Abbreviation: cAgNP, citrate-coated silver nanoparticle.
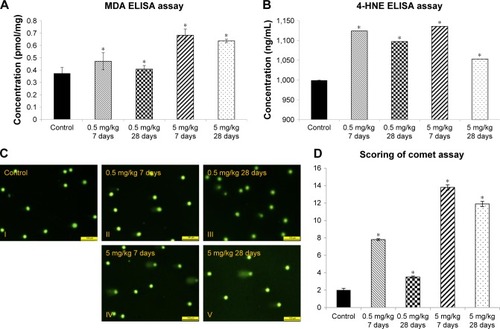
Figure 3 Signaling pathways associated with specifically regulated genes 28 days after cAgNP exposure.
Notes: Pathway Studio was used to explore the interactions among differentially expressed genes. (A) Cell process-related pathways with the genes identified 28 days after exposure were analyzed in the context of AgNPs. (B) Disease-related pathways with the genes are indicated in a purple box. Up- and downregulated genes 28 days after cAgNP exposure are highlighted in red and blue, respectively. The green highlight indicates AgNP-associated cell processes, diseases, or related genes.
Abbreviation: cAgNP, citrate-coated silver nanoparticle.
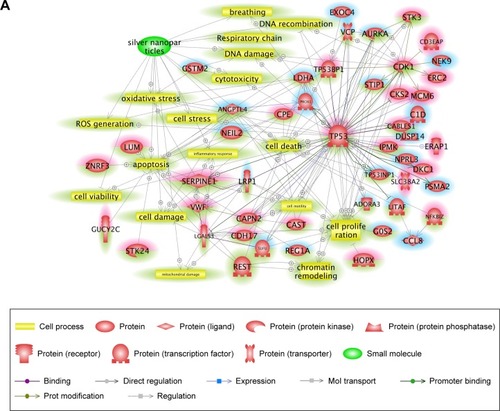
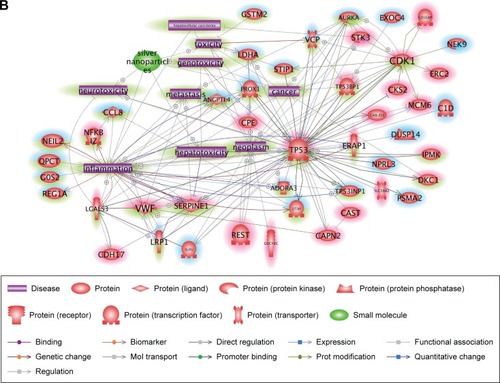
Figure 4 Molecular relationships among the cAgNP-affected genes 28 days after exposure.
Notes: Ingenuity Pathway Analysis was used for understanding the biological interactions between up- and downregulated genes induced 28 days after cAgNP exposure (highlighted in red and blue, respectively). The green highlight represents the upstream regulators predicted by Ingenuity Pathway Analysis. The pink-bordered elements are related to hepatic system diseases.
Abbreviation: cAgNP, citrate-coated silver nanoparticle.
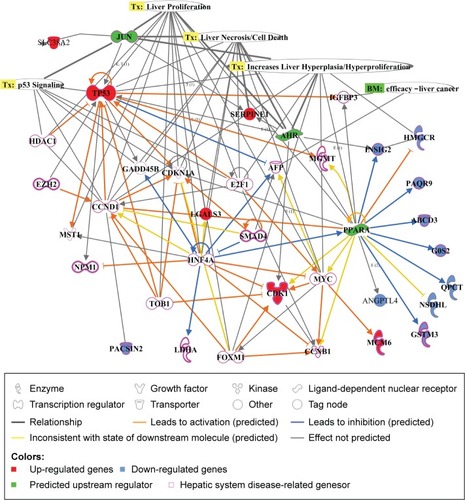
Figure 5 Core networks of significantly AgNP-associated genes.
Notes: The simplified pathway shows major associations among the genes related to the toxicity of retained cAgNPs and was carefully curated based on the number of references and connectivity. The pathway is derived from previous complex interactions analyzed by Pathway Studio or Ingenuity Pathway Analysis. Red and blue highlights indicate up- and downregulated genes, respectively. The green highlight indicates AgNP-associated cell processes, diseases, or related genes.
Abbreviation: cAgNP, citrate-coated silver nanoparticle.
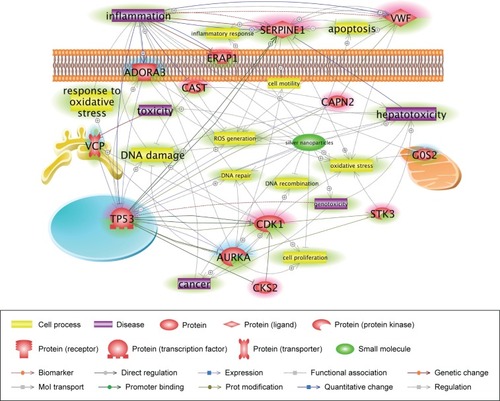
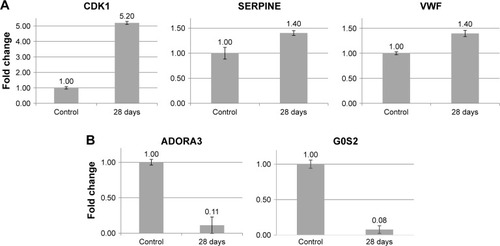
Figure 6 Validation of potential biomarkers of cAgNP exposure in rabbit liver tissue using qRT-PCR.
Notes: (A and B) Illustrate expression of up- and downregulated genes, respectively. Bars indicate the gene expression levels measured using qRT-PCR. The Y-axis denotes the fold-expression change of the respective genes.
Abbreviation: cAgNP, citrate-coated silver nanoparticle.