Figures & data
Figure 1 Chemical structure of andrographolide.
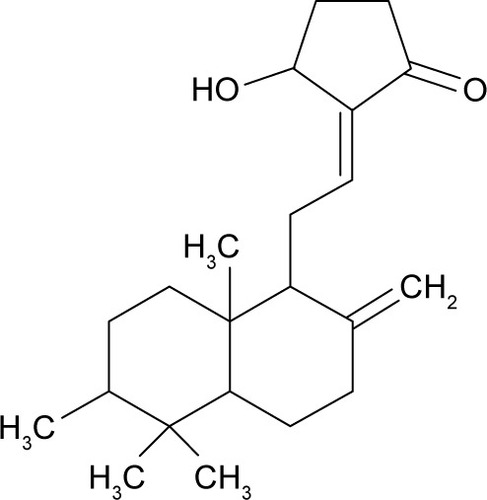
Figure 2 Experimental procedure of the deployment of the andrographolide-eluting membranes.
Notes: (A) A rat bearing the tumor. (B) An incision was made. (C) Implantation of nanofibrous membrane. (D) Wound was closed by sutures.
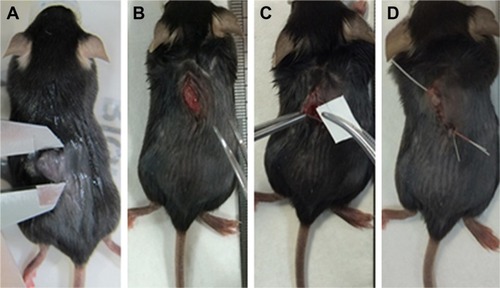
Figure 3 Scanning electron microscope images and fiber diameter distributions of (A) 6:1 and (B) 3:1 polymer-to-drug ratios.
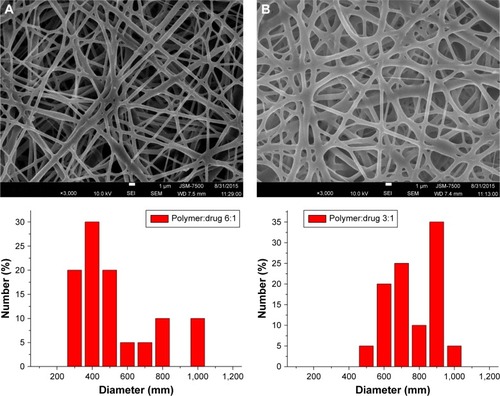
Figure 4 Water contact angles of (A) pure poly[(d,l)-lactide-co-glycolide] nano-fibers, and (B) 6:1 and (C) 3:1 polymer-to-drug ratio nanofibers.
![Figure 4 Water contact angles of (A) pure poly[(d,l)-lactide-co-glycolide] nano-fibers, and (B) 6:1 and (C) 3:1 polymer-to-drug ratio nanofibers.](/cms/asset/7ae882ad-9fbc-4653-8a13-e7b250246835/dijn_a_12190661_f0004_b.jpg)
Figure 5 Tensile properties of electrospun drug-eluting nanofibers.
Abbreviations: AG, andrographolide; PLGA, poly[(d,l)-lactide-co-glycolide].
![Figure 5 Tensile properties of electrospun drug-eluting nanofibers.Abbreviations: AG, andrographolide; PLGA, poly[(d,l)-lactide-co-glycolide].](/cms/asset/fa3d8731-ce4c-4289-a05e-122ba4fec233/dijn_a_12190661_f0005_c.jpg)
Figure 6 FTIR spectra of pure PLGA and andrographolide-loaded PLGA nanofibers.
Abbreviations: FTIR, Fourier transform infrared; PLGA, poly[(d,l)-lactide-co-glycolide].
![Figure 6 FTIR spectra of pure PLGA and andrographolide-loaded PLGA nanofibers.Abbreviations: FTIR, Fourier transform infrared; PLGA, poly[(d,l)-lactide-co-glycolide].](/cms/asset/aeb7f993-3b20-457f-b385-745a29466a23/dijn_a_12190661_f0006_c.jpg)
Figure 7 Daily (A) and accumulated release (B) of drug-eluting nanofibers in vitro.
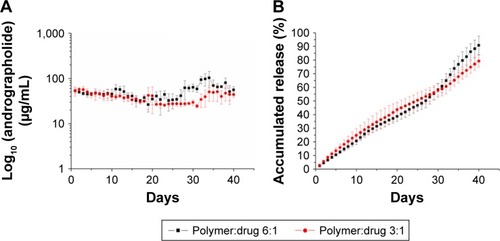
Figure 8 In vivo drug concentrations of andrographolide at the targeted tissue and in the plasma.
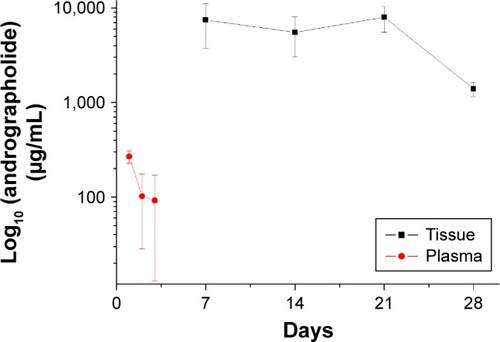
Figure 9 Images of the tumors on the backs of the mice.
Notes: A represents as group A; B represents as group B; C represents as group C. 0 represents as day 0; 7 represents as day 7; 14 represents as day 14; 21 represents as day 21; 28 represents as day 28.
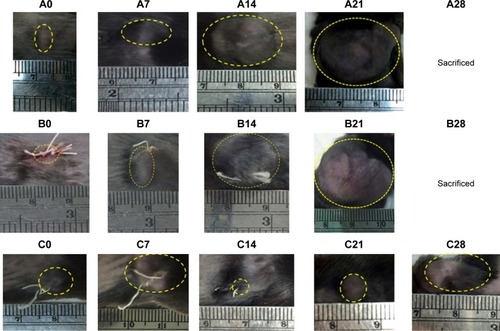
Figure 10 Variation of tumor sizes with time.
Notes: *P<0.05 and **P<0.01.
Abbreviations: AG, andrographolide; PLGA, poly[(d,l)-lactide-co-glycolide].
![Figure 10 Variation of tumor sizes with time.Notes: *P<0.05 and **P<0.01.Abbreviations: AG, andrographolide; PLGA, poly[(d,l)-lactide-co-glycolide].](/cms/asset/138faede-a2b8-4fa5-951d-514392d40911/dijn_a_12190661_f0010_c.jpg)
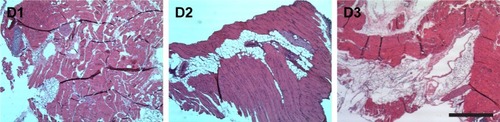
Figure 11 Histological analysis images at days 1–3 (D1–D3).
Notes: Scale bar 1 mm.