Figures & data
Figure 1 TEM image of PTX-NPs (magnification ×12,000).
Abbreviations: PTX-NPs, paclitaxel nanoparticles; TEM, transmission electron microscopy.
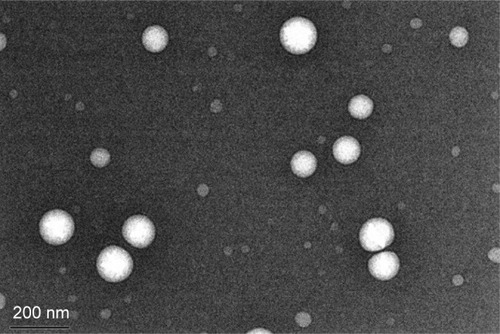
Figure 2 Effect of PTX-NPs on cell cycle and apoptosis of A549 cells, as determined by flow cytometry analysis.
Notes: (A) Representative histograms depicting cell cycle distribution in A549 cells treated with PTX and PTX-NPs at the indicated concentrations at 0, 5, 10, 15, and 20 HALO; (B) The percentages of cell death in A549 cells treated with PTX and PTX-NPs at the indicated concentrations at 0, 5, 10, 15 and 20 HALO. Compared to control, *P<0.05, and **P<0.01; compared to PTX, #P<0.05.
Abbreviations: HALO, hours after light onset; PTX, paclitaxel; PTX-NPs, paclitaxel nanoparticles; TEM, transmission electron microscopy.
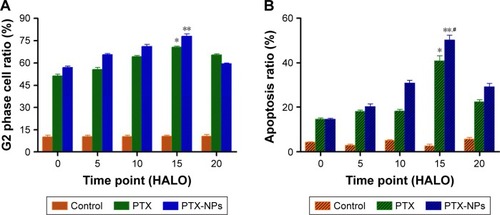
Figure 3 Per2 mRNA and protein expression after PTX-NPs treatment at 0, 5, 10, 15, and 20 HALO.
Notes: (A) The relative Per2 mRNA expression after PTX-NPs treatment at 0, 5, 10, 15, and 20 HALO; (B) Per2 expression was determined by Western blotting analysis; (C) The protein expression level of Per2 was analyzed by ImageJ software; (D) the protein expression level of Per2 was analyzed by ImageJ software. Compared to control, *P<0.05, and **P<0.01; compared to PTX, #P<0.05; ##P<0.01.
Abbreviations: HALO, hours after light onset; PTX, paclitaxel; PTX-NPs, paclitaxel nanoparticles.
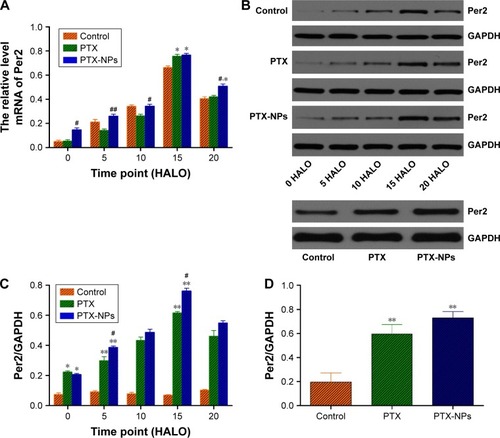
Figure 4 Antitumor effect of PTX-NPs on A549-transplanted null mice.
Notes: (A) Compared to tumor volume between control and PTX groups at different time points; (B) Compared to tumor volume between control and PTX-NPs groups at different time points; (C) Compared to tumor volume between PTX and PTX-NPs groups at 15 HALO; (D) Tumor growth inhibition rate (%) after injection with PTX or PTX-NPs. *P<0.05. Mice treated with saline were used as controls.
Abbreviations: HALO, hours after light onset; PTX, paclitaxel; PTX-NPs, paclitaxel nanoparticles.
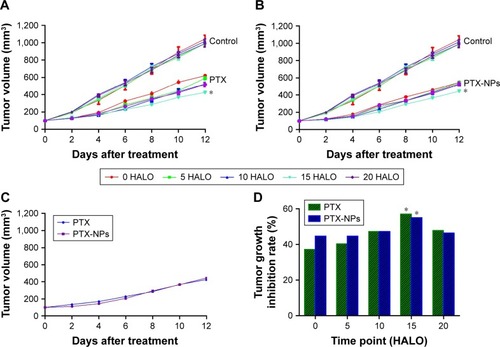
Figure 5 The relative expression of Per2, Bax, and Bcl-2 mRNA in A549-transplanted null mice after PTX-NPs treatment at 0, 5, 10, 15, and 20 HALO in vivo.
Notes: (A) The relative mRNA level of Per2; (B) The relative mRNA level of Bax; (C) The relative mRNA level of Bcl-2. Compared to control, *P<0.05, and **P<0.01; compared to PTX, #P<0.05. Mice treated with saline were used as controls.
Abbreviations: HALO, hours after light onset; PTX, paclitaxel; PTX-NPs, paclitaxel nanoparticles.
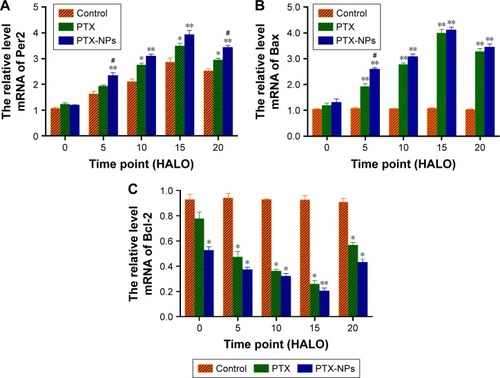
Figure 6 The protein expression of Per2, Bax, and Bcl-2 after PTX-NPs treatment at 0, 5, 10, 15, and 20 HALO.
Notes: (A) Per2, Bax, and Bcl-2 expression in A549-transplanted null mice was determined by Western blotting analysis; (B) The protein expression of Per2 after PTX-NPs treatment at 15 HALO; (C–E) The protein expression level of Per2, Bax, and Bcl-2 were analyzed by ImageJ software; (F) the protein expression level of Per2 were analyzed at 15 HALO by ImageJ software. GAPDH was used as an internal control. Compared to control, *P<0.05, and **P<0.01; compared to PTX, #P<0.05. Mice treated with saline were used as controls.
Abbreviations: HALO, hours after light onset; PTX, paclitaxel; PTX-NPs, paclitaxel nanoparticles.
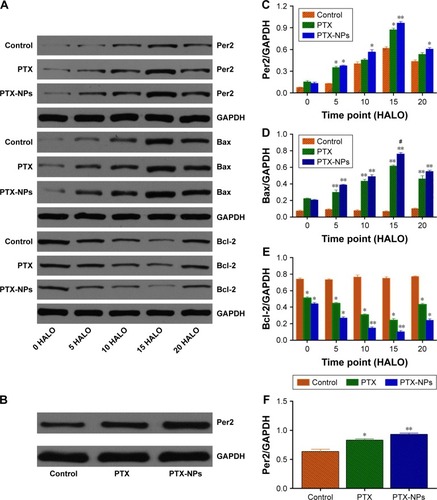
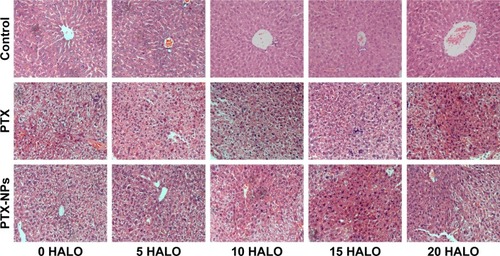
Figure 7 Liver damage after PTX-NPs treatment of A549-transplanted null mice at 0, 5, 10, 15, and 20 HALO (400×).
Abbreviations: HALO, hours after light onset; PTX, paclitaxel; PTX-NPs, paclitaxel nanoparticles.