Figures & data
Figure 1 (A) UV–vis spectra and (B) TEM images of EO-AuNPs.
Abbreviations: UV–vis, ultraviolet-visible; E. officinalis, Euphrasia officinalis; EO-AuNPs, E. officinalis-gold nanoparticles; TEM, transmission electron microscopy; SPR, surface plasmon resonance.
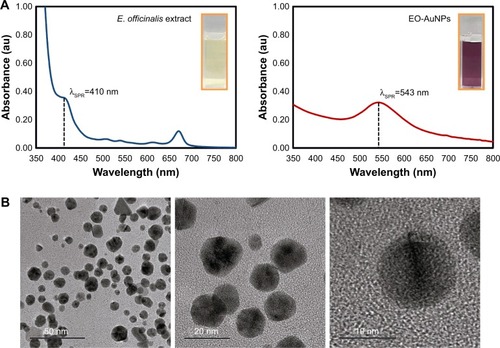
Figure 2 (A and B) Elemental mapping, (C) EDX spectrum, (D) XRD, and (E) SAED pattern of EO-AuNPs.
Abbreviations: EDX, energy-dispersive X-ray; XRD, X-ray diffraction; SAED, selected area electron diffraction; EO-AuNPs,Euphrasia officinalis-gold nanoparticles.
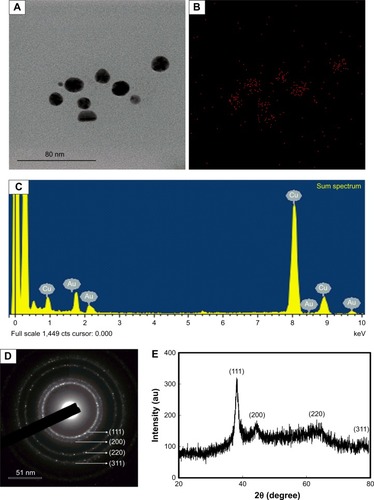
Figure 3 FTIR analysis of synthesized EO-AuNPs and plant extract of E. officinalis.
Abbreviations: FTIR, fourier-transform infrared; E. officinalis, Euphrasia officinalis; EO-AuNPs, E. officinalis-gold nanoparticles.
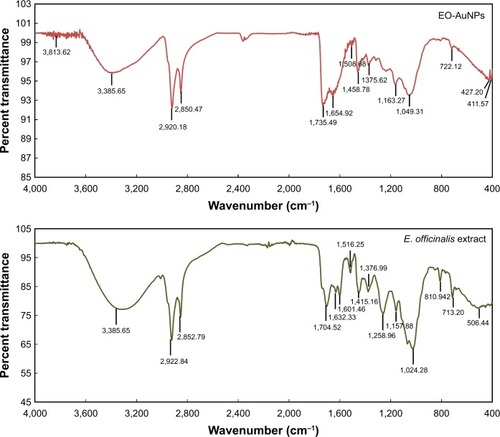
Figure 4 Uptake of EO-AuNPs by RAW 264.7 cells observed with an enhanced dark-field (EDF) microscopy. Cells were incubated with EO-AuNPs (80 µg/mL) for 5 minutes and 3 hours and then were observed by EDF illumination system. The bright white spots inside the macrophages represent the aggregation of EO-AuNPs.
Abbreviations: DIC, differential interference contrast; TIRS, thermal infrared sensor; EO-AuNPs, Euphrasia officinalis-gold nanoparticles.
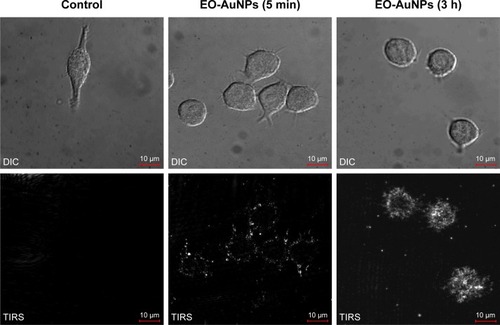
Figure 5 Intracellular localization of EO-AuNPs in RAW 264.7 cells observed by a transmission electron microscopy (TEM). Cells were treated with EO-AuNPs (40 and 80 µg/mL) for 3 hours and then were fixed and examined by TEM (scale bar =1 µm). EO-AuNPs are distributed in the membrane-bound compartments, resembling endosomes or lysosomes.
Abbreviations: N, nucleus; Mi, mitochondria; ER, endoplasmic reticulum; En, endosome; Ly, lysosome; EO-AuNPs, Euphrasia officinalis-gold nanoparticles.
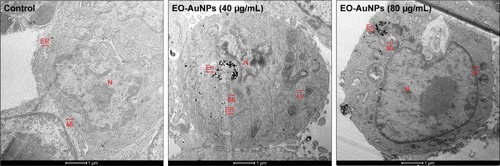
Figure 6 Effect of EO-AuNPs on LPS-induced inflammatory mediators production in RAW 264.7 cells. (A) Cell viability was measured by MTT assay. (B) The concentration of NO in medium was measured by Griess method. (C–E) The production of TNF-α, IL-1β, and IL-6 in medium was measured using ELISA kits. Data are representative of three independent experiments and values are shown as mean ± SEM. *P<0.05, **P<0.01, ***P<0.001 compared to non-treated control. #P<0.05, ##P<0.01, ###P<0.001 compared to the LPS control.
Abbreviations: TNF-α, tumor necrosis factor-α; EO-AuNPs, Euphrasia officinalis-gold nanoparticles; LPS, lipopolysaccharide; NO, nitric oxide; SEM, standard error of the mean.
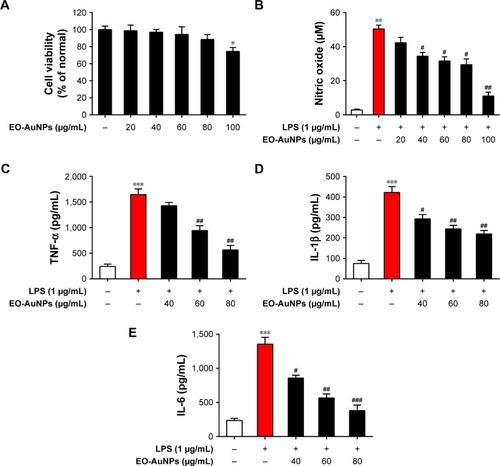
Figure 7 Effect of EO-AuNPs on LPS-induced iNOS expression in RAW 264.7 cells. (A and B) mRNA expression of iNOS was determined by RT-PCR analysis and normalized to the corresponding value of GAPDH. (C and D) Protein expression of iNOS was determined by Western blot analysis and normalized to the corresponding value of β-actin. Densitometry data are expressed as percentage relative to the non-treated control and shown as mean ± SEM. **P<0.01 compared to the non-treated control. #P<0.05, ##P<0.01 compared to the LPS control.
Abbreviations: iNOS, inducible nitric oxide synthase; EO-AuNPs, Euphrasia officinalis-gold nanoparticles; LPS, lipopolysaccharide; RT-PCR, reverse transcription-PCR; SEM, standard error of the mean; GAPDH, glyceraldehyde-3-phosphate dehydrogenase.
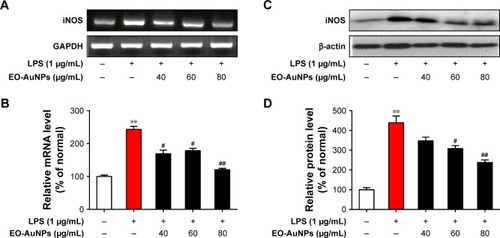
Figure 8 Effect of EO-AuNPs on NF-κB signaling-related protein expression in RAW 264.7 cells. (A and C) The proteins of cytosolic p-IκBα, IκBα, and nuclear NF-κB p65 in LPS-stimulated RAW 267.4 cells were measured by Western blot analysis. The band intensities for (B and D) p-IκBα, IκBα, and nuclear NF-κB p65 were quantified and normalized to the corresponding value of β-actin and histone. Densitometry data are expressed as percentage relative to the non-treated control and shown as mean ± SEM. *P<0.05, **P<0.01, ***P<0.001 compared to the non-treated control. #P<0.05, ##P<0.01, ###P<0.001 compared to the LPS control.
Abbreviations: NF-κB, nuclear factor kappa-B; p-IκBα, phosphorylated inhibitor kappa B-alpha; EO-AuNPs, Euphrasia officinalis-gold nanoparticles; LPS, lipopolysaccharide; SEM, standard error of the mean.
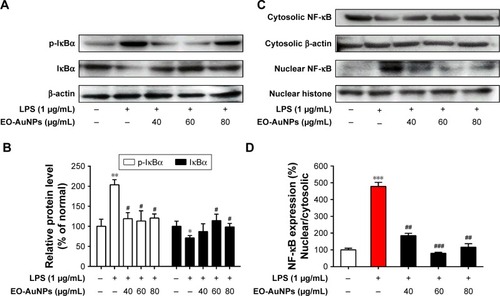
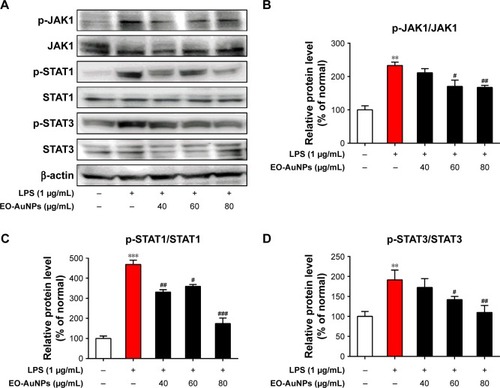
Figure 9 Effect of EO-AuNPs on JAK/STAT signaling-related protein expression in RAW 264.7 cells. (A) The proteins of p-JAK1, JAK1, p-STAT1, STAT1, p-STAT3, and STAT3 in LPS-stimulated RAW 267.4 cells were measured by Western blot analysis. (B–D) The band intensities for p-JAK1/JAK1, p-STAT1/STAT1, and p-STAT3/STAT3 were quantified and normalized to the corresponding value of β-actin. Densitometry data are expressed as percentage relative to the non-treated control and shown as mean ± SEM. **P<0.01, ***P<0.001 compared to the non-treated control. #P<0.05, ##P<0.01, ###P<0.001 compared to the LPS control.
Abbreviations: JAK, Janus kinase; STAT, signal transducer and activators of transcription; EO-AuNPs, Euphrasia officinalis-gold nanoparticles; LPS, lipopolysaccharide; SEM, standard error of the mean.