Figures & data
Figure 1 Biological effects of cavitating microbubbles. After ultrasound exposure, microbubbles rupture near the cell membrane, leading to the formation of sonoporation. This allows the therapeutic substance to diffuse passively into cells. The shear stress generated by microbubble cavitation results in cytoskeletal rearrangements, altering the membrane tension. The change of cell membrane tension can be sensed by mechanosensors, thus modulating the process of endocytosis.
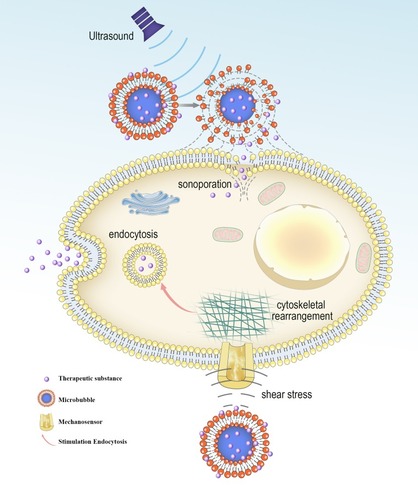
Figure 2 Evaluation of molecular targeted attachment of microbubbles using ARF. Without ARF, targeted microbubbles moving towards the direction of blood flow, thereby low adherence to the target. When ARF pulse exposure, the pulse pushes targeted microbubbles to the contralateral vascular wall, thus increasing targeted attachment of microbubbles.
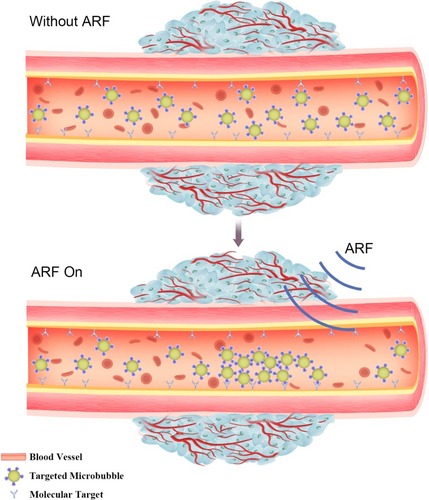
Table 1 Clinical Microbubbles
Figure 3 (A) Schematic representation showing the structure of derivatized 1,3-PD (MW: 162) and determination of derivatized 1,3-PD encapsulation in E-LTSLs using gas chromatography-mass spectrometry (GC-MS). (B) Continuous high-resolution tumor blood vessels US images following intravenous injection of E-LTSL in a mouse model. A gradual increase in contrast after injection was shown at (a) 0 min, (b) 5 min, (c) 10 min, (d) 15 min. (C) Significantly greater drug release in heated sample (LTSL & ELTSL, HIFU) relative to unheated control at 37°C were respectively noted in cell supernatant (left) and 3D tumour spheroid (right) (*p<0.05). Adapted with permission from Maples D, McLean K, Sahoo K, et al. Synthesis and characterisation of ultrasound imageable heat-sensitive liposomes for HIFU therapy. International Journal of Hyperthermia. 2015;31(6):674–685. Copyright 2015 Taylor & Francis Ltd; http://www.tandfonline.com; reprinted by permission of the publisher.Citation33
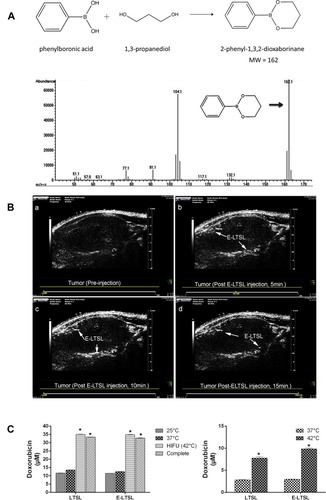
Figure 4 (A) Illustration showing the mechanism of the US combined with DPMC to deliver DOX into nuclei. (B) In vitro and In vivo antitumor efficacy. (a) In vitro cytotoxicity of MCF-7 cells respectively incubated with DOX, DP, DPMC with US, and MB with US. (b) In vivo tumor growth inhibition of DPMC with or without US, DOX and saline in a breast tumor model. DPMC with US obtained significant tumor inhibition. At the end of the experiment, tumor tissues were collected from sacrificed animals, photographed (d) and weighed (c) (***p<0.001; ** p<0.01; * p<0.05). (C) Histological analysis of tumors from mice with different treated groups (left) and corresponding quantification of Caspase-3, Ki67 and CD34 staining (right) (***p<0.001; ** p<0.01). Adapted from Luo W, Wen G, Yang L, et al. Dual-targeted and pH-sensitive Doxorubicin Prodrug-Microbubble Complex with Ultrasound for Tumor Treatment. Theranostics. 2017;7(2):452–465. Copyright 2017 Ivyspring International Publisher (https://creativecommons.org/licenses/by-nc/4.0/legalcode).Citation43
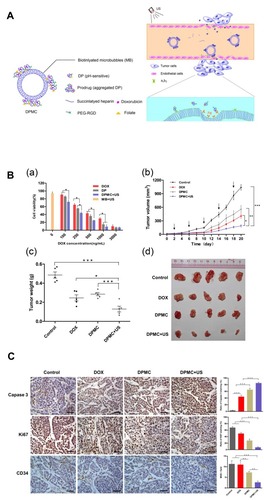
Figure 5 (A) Schematic illustration showing the process of photoacoustic imaging (PAI). Adapted from Wang S, Lin J, Wang T, Chen X, Huang P. Recent Advances in Photoacoustic Imaging for Deep-Tissue Biomedical Applications. Theranostics. 2016;6(13):2394–2413. © 2016 Ivyspring International Publisher (https://creativecommons.org/licenses/by-nc/4.0/legalcode).Citation48 (B) Schematic illustration of (a) surface plasmons and (b) a localized surface plasmon. Adapted with permission from Mayer KM, Hafner JH. Localized surface plasmon resonance sensors. Chemical Reviews. 2011;111(6):3828–3857. Copyright © 2011 American Chemical Society.Citation50
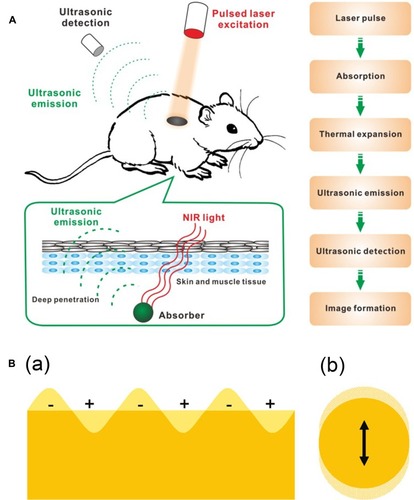
Figure 6 Physiological characteristics of tumor tissues and vasculatures that can restrain drug delivery. Adapted from Kobayashi H, Watanabe R, Choyke PL. Improving conventional enhanced permeability and retention (EPR) effects; what is the appropriate target? Theranostics. 2013;4(1):81–89. Copyright 2013 Ivyspring International Publisher (https://creativecommons.org/licenses/by-nc/4.0/legalcode).Citation62
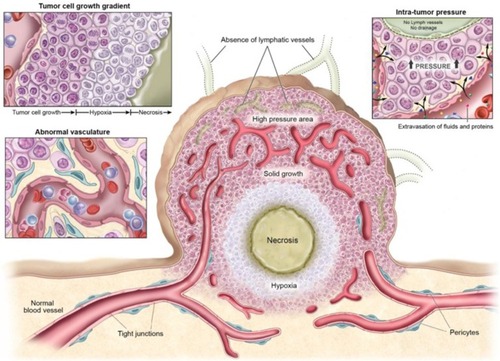
Figure 7 (A) Schematic illustration of drug-loaded and echogenic chitosan-based nanoparticles (Echo-CNPs). Size distribution (B) and TEM images (C) of Echo-CNPs compared with CNPs, Sonovue®, and PFP-GC. (D) In vivo biodistribution of fluorescent FlammaTM labeled Echo-CNPs after 1 h, 3 h, 24 h, and 48 h post-tail vein injection with or without US irradiation. (E) Fluorescent intensities on the target tumor tissue after 1 h and 3 h post-injection with or without US treatment. (F) In vitro fluorescence imaging of the excised tumor tissues with or without US treatment. (G) Real-time dynamic drug release process visualized by OV-100 micro-vessel imaging system in tumor tissue after 10 min tail vein injection, and subsequently exposed to US destruction mode for 5 min. Adapted from Min HS, You DG, Son S, et al. Echogenic Glycol Chitosan Nanoparticles for Ultrasound-Triggered Cancer Theranostics. Theranostics. 2015;5(12):1402–1418. Copyright 2015 Ivyspring International Publisher (https://creativecommons.org/licenses/by-nc/4.0/legalcode).Citation64
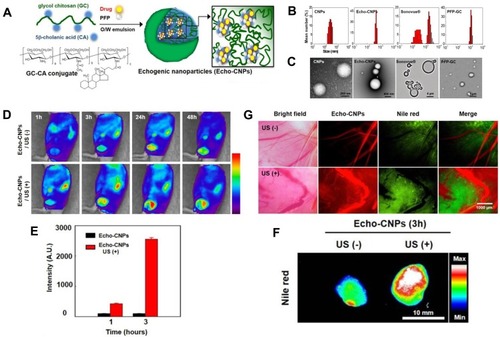
Figure 8 Targeted microbubble for ultrasound-mediated short hairpin RNA plasmid transfection to silence survivin gene and exert the antitumor effect (#p<0.05; *p<0.05). Adapted with permission from Zhang Y, Chang S, Sun J, et al. Targeted Microbubbles for Ultrasound Mediated Short Hairpin RNA Plasmid Transfection to Inhibit Survivin Gene Expression and Induce Apoptosis of Ovarian Cancer A2780/DDP Cells. Mol Pharm. 2015;12(9):3137–3145. Copyright © 2015 American Chemical Society.Citation117
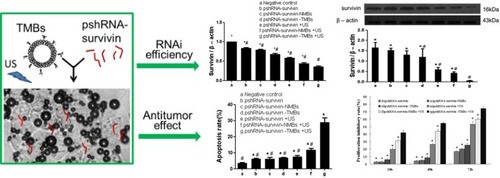
Figure 9 (A) Pattern diagram for the blood–brain barrier (BBB) opening in mice induced by MRI-guided focused ultrasound. (B) The mice BBB opening monitored by coronal (COR) and axial (AX) MR images (arrows). (Lower Left) Trypan blue staining the location of the BBB opening. (Lower Right) HE staining shows no apparent macroscopic damage related to BBB disruption. (C) MR-intensity change between the sonicated target (○) and the contralateral side (control; ●). (D) Graphs show Herceptin concentrations in the sonicated or control groups as a function of the applied acoustic pressure. *In the control (0 MPa), herceptin was below the lower limit of the detection range (780 ng/g of tissue) in eight of nine cases. Adapted from Kinoshita M, McDannold N, Jolesz FA, Hynynen K. Noninvasive localized delivery of Herceptin to the mouse brain by MRI-guided focused ultrasound-induced blood-brain barrier disruption. Proc Natl Acad Sci USA. 2006;103(31):11, 719–11, 723. © 2006 by The National Academy of Sciences of the USA.Citation137
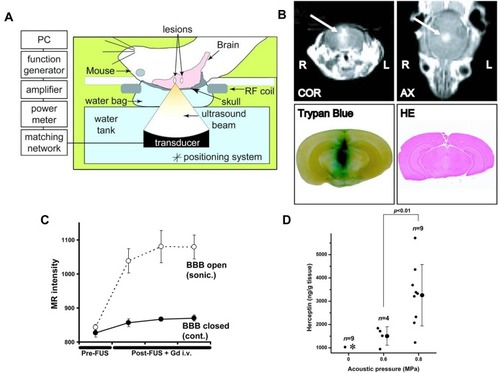
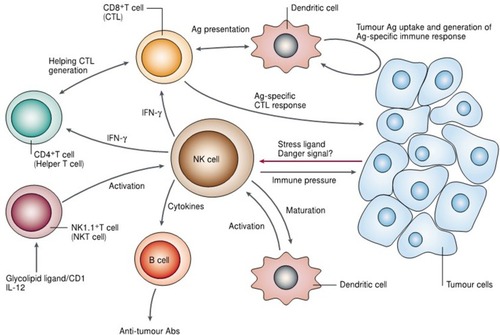
Figure 10 Illustration indicating the potential role of natural killer (NK) cells in tumor immune surveillance and tumor immune response. Adapted with permission from Smyth MJ, Yoshihiro H, Kazuyoshi T, et al. New aspects of natural-killer-cell surveillance and therapy of cancer. Nature Reviews Cancer. 2002;2(11):850–861. Copyright © 2002, Springer Nature. https://www.nature.com/articles/nrc928.Citation143