Figures & data
Figure 1 Synthesis and characterization of drug-loaded liposomes. (A) Schematic representation of the synthesis of drug-loaded liposomes. (B) Hydrodynamic diameter histograms of respective liposomes obtained from DLS intensity measurements. (C) Representative TEM images of respective liposomes. Bar Length =100 nm.
Abbreviations: DOPC, 1,2-dioleoyl-sn-glycero-3-phosphocholine; TTP, tumor targeting peptide; DSPE-PEG2000-OMe, 1,2-distearoyl-sn-glycero-3-phosphoethanolamine-N-[methoxy(polyethylene glycol)-2000] (ammonium salt).
![Figure 1 Synthesis and characterization of drug-loaded liposomes. (A) Schematic representation of the synthesis of drug-loaded liposomes. (B) Hydrodynamic diameter histograms of respective liposomes obtained from DLS intensity measurements. (C) Representative TEM images of respective liposomes. Bar Length =100 nm.Abbreviations: DOPC, 1,2-dioleoyl-sn-glycero-3-phosphocholine; TTP, tumor targeting peptide; DSPE-PEG2000-OMe, 1,2-distearoyl-sn-glycero-3-phosphoethanolamine-N-[methoxy(polyethylene glycol)-2000] (ammonium salt).](/cms/asset/0138c595-84bb-42f7-b13c-4fd7effe2f42/dijn_a_12190914_f0001_c.jpg)
Table 1 Composition of liposomes, drug loading efficiency (DLE) and encapsulation efficiency (EE). Composition, drug loading efficiency and encapsulation efficiency of empty liposome (L), liposomes containing Everolimus (E-L), Vinorelbine (V-L), and combination of and combination of Everolimus and Vinorelbine (EV-L)
Table 2 Characterization of liposomal drug formulations. Hydrodynamic size, polydispersity index (PDI) and zeta potential of empty liposomes (L), or liposomes containing Everolimus (E-L), Vinorelbine (V-L), and combination of Everolimus and Vinorelbine (EV-L). All the measurements were performed in deionized water at 25°C
Figure 2 In vitro cellular uptake of Rhodamine-PE-labeled liposomes in RCC cell lines. 786-O and A498 cells were treated with Rhodamine-PE-labeled control liposomes (CL) or TTP-conjugated Liposomes (TL) for 4 hrs. Nuclei of the cells were counterstained with Hoechst for the last 30 mins. Finally, cells were washed three times with PBS and images were captured using EVOS fluorescence microscope under bright field, blue and red channel. TL treated cells showed significantly higher uptake of Rhodamine dye compared to CL-treated cells in all cell lines. Bar length =200 µm.
Abbreviations: CL, control liposome; TL, tumor targeting peptide-conjugated liposome.
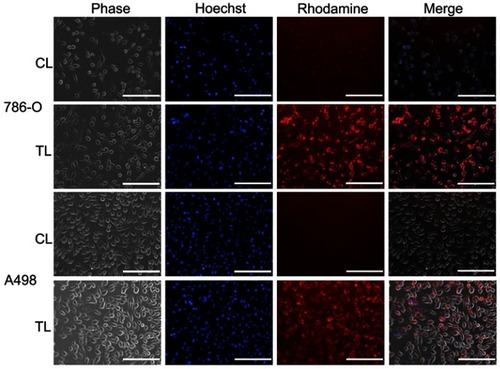
Figure 3 In vivo biodistribution of IR-780-dye-labeled liposomes in RCC xenografts. IVIS imaging showing higher tumor accumulation of IR-780 dye-labeled TTP-conjugated liposomes (TL) compared to control liposomes (CL) at 24 hrs (upper panel) and 48 hrs (lower panel) after IV administration into mice bearing subcutaneous 786-O (A) and A498 tumors (B) One untreated mouse (UT) was used for background correction. Ex vivo imaging of 786-O (C) and A498 (D) tumors and major organs, respectively, harvested at 48 hrs demonstrated significant higher tumor uptake of TL compared to CL. Interestingly, significantly higher lung accumulation of CL was observed compared to TL.
Abbreviations: UT, untreated; CL, control liposome; TL, tumor targeting peptide-conjugated liposome.
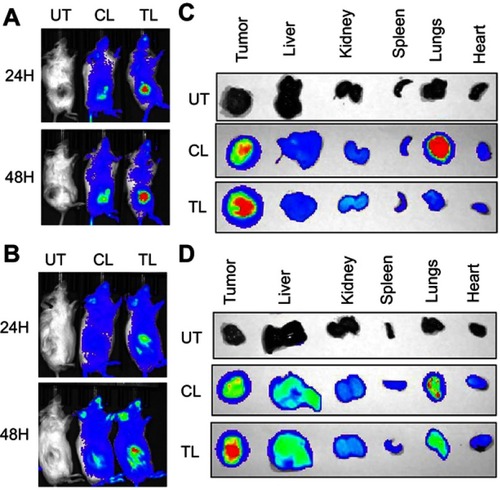
Figure 4 In vitro and in vivo efficacy of drug-loaded liposomes in RCC cell lines. 786-O (A) and A498 (B) cells were treated with various drug-loaded TTP-conjugated Liposomes for 72 hrs. Then, cell viability was determined with MTS assay. Dual drug-loaded liposomes showed higher reduction in cell viability compared to single drug-loaded liposomes in all cell lines. (C) 5×10⁶ 786-O cells were subcutaneously injected into the right flanks of 8 weeks old male SCID mice. Tumors were allowed to grow until the average tumor size is ~400–500 mm3. Then, mice were treated with drug-loaded liposomes (one mouse per treatment group) 3x/wk for 3 weeks. Tumors were measured weekly and tumor volume is plotted to obtain the respective growth curves. In both cases, dual-drug-loaded liposomes demonstrated significant inhibition compared to single drug-loaded liposomes. Some of the mice were sacrificed before the completion of experiment due to ulceration of tumors. (D) Similar results were obtained in A498 xenografts.
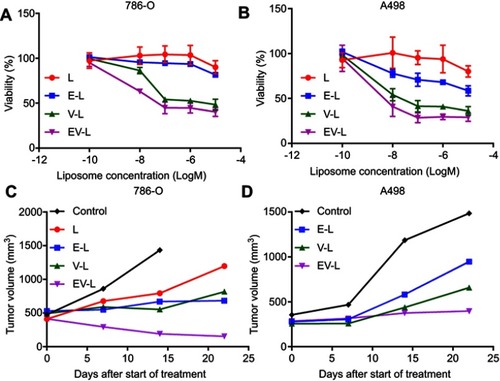
Figure 5 H&E and Ki67 staining of tumor sections obtained from the single mouse trial. (A) Representative images of the H&E and Ki67-stained tumor sections from different treatment groups displayed comparatively higher anti-proliferative activity of EV-L. Bar length =200 µm. (B & C) Quantification of Ki67 positive nuclei in 786-O and A498 tumor sections, respectively. * and *** denotes p<0.05 and p<0.001 compared to control, respectively.
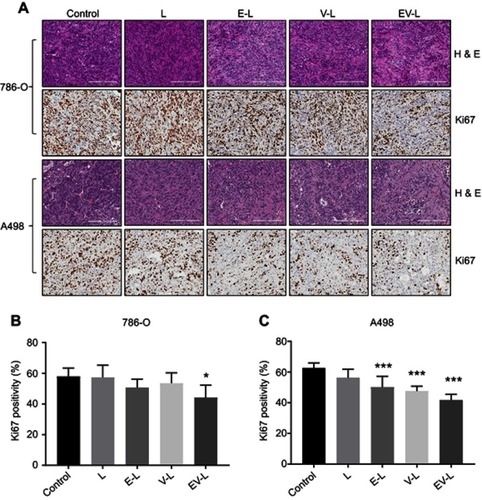
Figure 6 Validation of the result obtained from single mouse trial in cohorts of 5 mice. (A) 5×10⁶ 786-O cells were subcutaneously injected into the right flanks of 8 weeks old male SCID mice. Tumors were allowed to grow until the average tumor size is ~300 mm3. Then, mice were treated with vehicle or EV-L (five mice per treatment group) 3x/wk for 3 weeks. Tumors were measured weekly and tumor volume is plotted to obtain the respective growth curves. EV-L demonstrated significant inhibition compared to the vehicle group. (B) Images of the harvested tumors at the end of the experiment. (C) Representative images of H&E and Ki67 staining of the tumor tissue sections. Bar length =200 µm. (D) Quantification of Ki67 positive nuclei. *** denotes p<0.001 compared to control.
Abbreviation: H & E, hematoxylin and eosin.
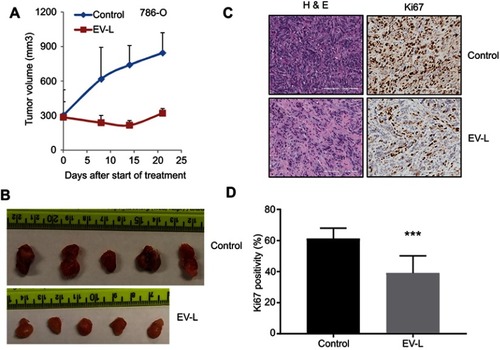
Figure 7 Inhibition of lung metastasis in 786-O xenografted mice. The dual drug-loaded liposomes significantly inhibited lung metastasis in mice bearing 786-O subcutaneous tumors compared to untreated, liposome only of single drug-loaded liposomes. Metastatic nodules were indicated by black arrows. The lower panel demonstrates magnified portions from the upper panel.
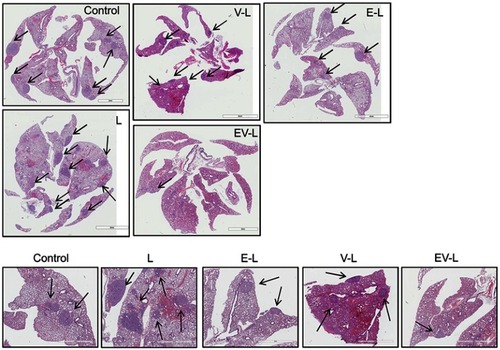
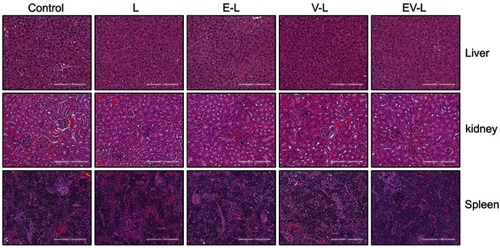
Figure S1 H&E staining of liver, kidney and spleen collected from mice bearing 786-O xenografts. Bar length =200 µm
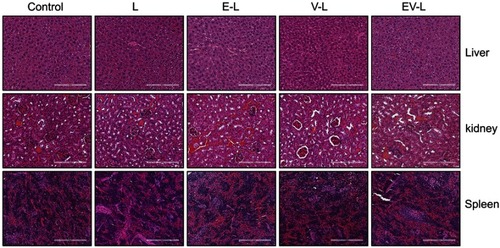
Figure S2 H&E staining of liver, kidney and spleen collected from mice bearing A498 xenografts. Bar length =200 µm