Figures & data
Table 1 Composition of liposomes
Table 2 Size and surface characteristics of the AZI-liposomes
Table 3 Characteristics of the AZI-liposomes at simulated vaginal conditions
Table 4 Liposome bilayer elasticity
Figure 1 Encapsulation of AZI in different types of liposomes expressed as the encapsulation efficiency (%) and the drug-per-lipid ratio.
Notes: The values indicate the mean ± S.D. *Significantly different from DPGL-1 (ANOVA, p<0.05). **Significantly different from the corresponding highly negatively surface-charged liposomes (t-test, p<0.05). Abbreviation: AZI, azithromycin.
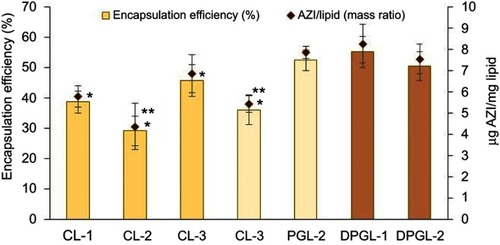
Figure 2 In vitro AZI release from the different types of liposomes.
Notes: The each value represents the mean ± S.D. (n=3). One-way ANOVA and Tukey’s multiple comparison test, with p<0.05 set as the minimal level of significance, were applied for comparison of AZI release from the different types of liposomes and control. The control, representing a solution of AZI, was examined at pH 7.5. *Significantly different (ANOVA, p<0.05) from the control (period 1–24 h). **Significantly different (ANOVA, p<0.05) from the control (period 2–24 h).Abbreviation: AZI, azithromycin.
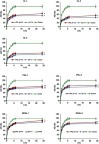
Figure 3 Physical stability of different AZI-liposomes: mean diameters (A), polydispersity indexes (B) and zeta potentials (C).
Notes: The each value represents the mean ± S.D.; n=3 (mean diameter, polydispersity index); n=5 (zeta potential). For each type of AZI-liposomes, the values determined during 2–8 months were compared with the corresponding initial values using Student’s t-test, with p<0.05 set as the minimal level of significance. The standard deviations and statistically significant differences are not shown due to the clarity of presentation. Statistically significant increase in mean diameters and polydispersity indexes are determined for CL-2 and DPGL-1 (2–8 months) and for PGL-1 (5–8 months).
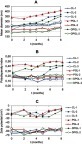
Figure 4 Schematic drawing of the AZI-liposomes explored for ex vivo vaginal deposition/penetration, in vitro antibacterial activity and biocompatibility studies.
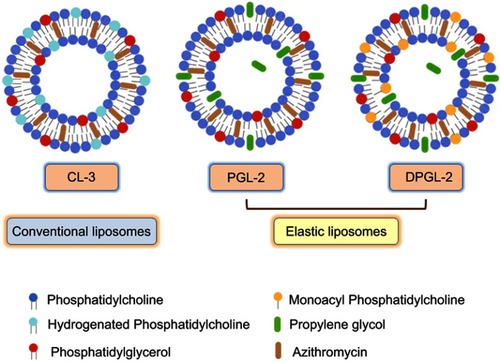
Figure 5 Ex vivo deposition/penetration of AZI into/through porcine vaginal tissue.
Notes: The each value represents the mean ± S.D. (n=3). One-way ANOVA and Tukey’s multiple comparison test, with p<0.05 set as the minimal level of significance, were applied for comparison of the levels of nonpenetrated, penetrated and AZI retained in the tissue, from different types of AZI-liposomes and control. *Significantly different (ANOVA, p<0.05) from free AZI (control). **Significantly different (ANOVA, p<0.05) from CL-3. Abbreviation: AZI, azithromycin.
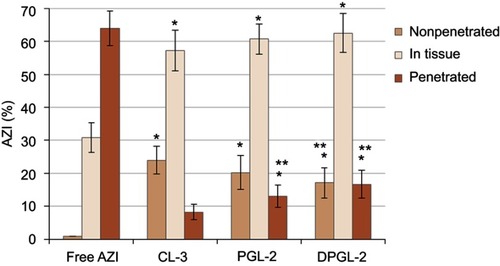
Table 5 Antimicrobial activity of AZI-liposomes against planktonic bacteria and biofilms in the pre-exposure mode of the assay, as measured by turbidity measurements and resazurin staining, respectively
Table 6 Eradication of E. coli biofilms at the highest tested concentration (78.50 µg/ml) in the postexposure mode of the assay, as measured using a resazurin staining assay
Figure 6 In vitro activities of AZI-liposomes against C. trachomatis presented as MIC values.
Notes: C. trachomatis (MOI 0.2)-infected HeLa cells were cultured in the presence of 0.5–0.0002 μg/ml free or liposomally loaded AZI (CL-3, PGL-2 and DPGL-2). C. trachomatis genome concentrations were measured at 48 h post infection by direct qPCR. Data are presented as the mean Ct levels ± S.D. (n=3). Abbreviations: AZI, azithromycin; Ct, cycle threshold; MIC, minimum inhibitory concentration; qPCR, quantitative polymerase chain reaction.
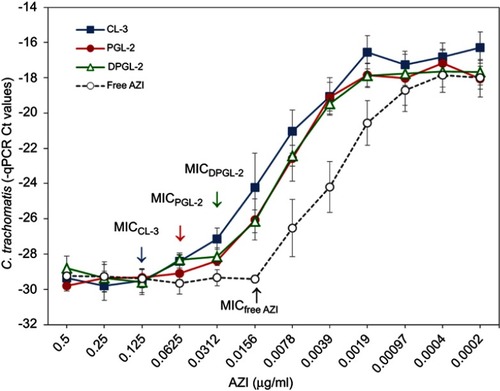
Figure 7 Estimation of the impact of AZI-liposomes and free AZI on qPCR.
Notes: Chlamydia-specific qPCRs were performed in the presence of AZI-liposomes and free AZI at the highest applied concentrations that were used in the dose-response curve measurement experiments. One-way ANOVA and Tukey’s multiple comparison test, with p<0.05 set as the minimal level of significance, were applied for comparison of qPCR Ct levels of CL-3, PGL-2, DPGL-2 and free AZI containing samples and control. No significant differences were found (p>0.05). Data are presented as the mean Ct value ± S.D. (n=3). Abbreviations: AZI, azithromycin; Ct, cycle threshold; qPCR, quantitative polymerase chain reaction.
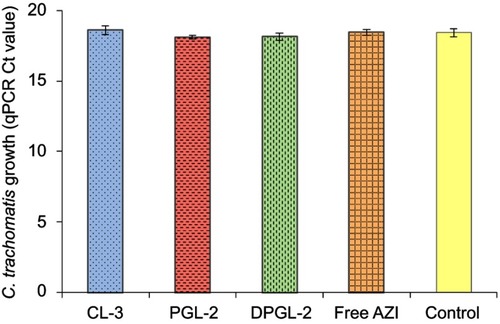
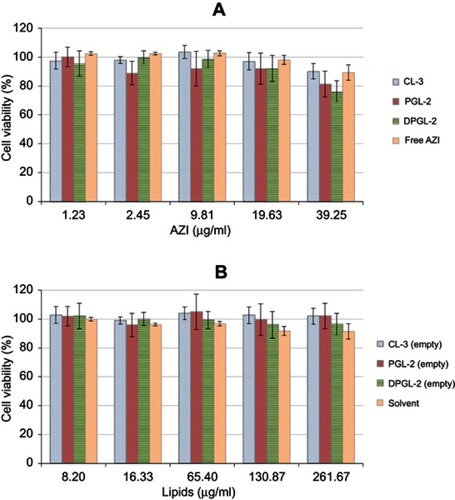
Figure 8 Viability of HeLa cells after incubation with different AZI-liposomes or free AZI (A) and with the corresponding empty liposomes (without AZI) or the solvent used to dissolve free AZI (B).
Note: The presented values are the mean ± S.D. (n=3). Abbreviation: AZI, azithromycin.