Figures & data
Table 1 The limit of independent variables compositions
Figure 1 The ternary phase diagrams of MCT/surfactant/NaCl: GEM systems at different Tween 80: Span 80, T80:S80 ratios; (A) 1:1 (B) 3:2 (C) 3:7. Li = Isotropic phase and M = multiple phase.
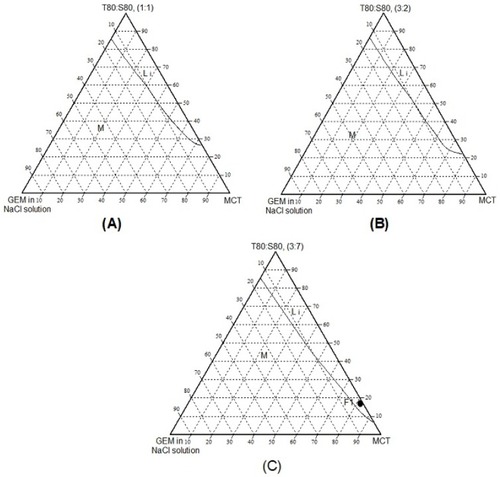
Table 2 The composition of the selected point for MCT/surfactants/NaCl system
Table 3 The predicted and actual particle size values of nanoemulsions
Table 4 The analysis of variance (ANOVA) for the model
Figure 2 (A) The contour plot of two-dimensional plot and three-dimensional surfaces with a constant amount of surfactant (T80: S80 (C)), showing the interaction effect between three variables (NaCl solution (A), GEM (B), MCT (D)). (B) The contour plot of two-dimensional plot and three-dimensional surfaces with a constant amount of oil (MCT (D)), showing the interaction effect of three variables (NaCl solution (A), GEM (B), T80: S80 (C)).
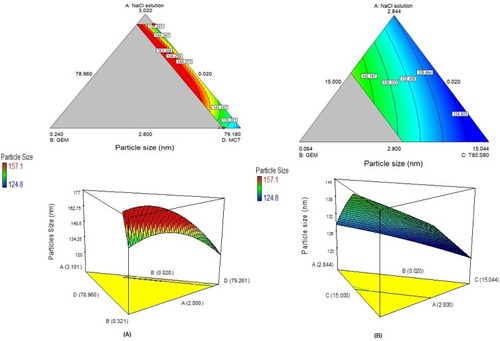
Table 5 Validation set and optimized nanoemulsion
Figure 3 Morphology of the optimized nanoemulsion at 100 nm of magnification.
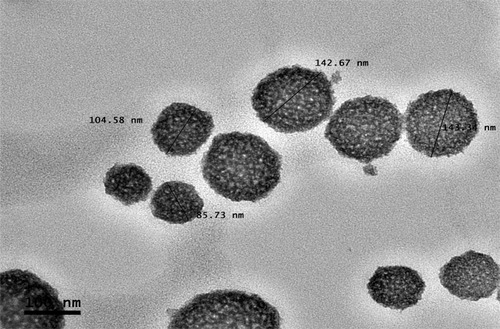
Table 6 Physical stability of optimized nanoemulsion containing GEM
Figure 4 Stability of the optimized nanoemulsion against time.
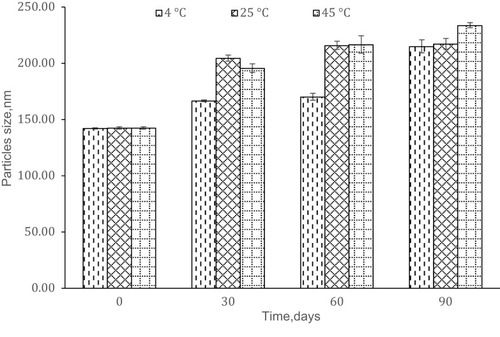
Figure 5 Coalescence rate analysis.
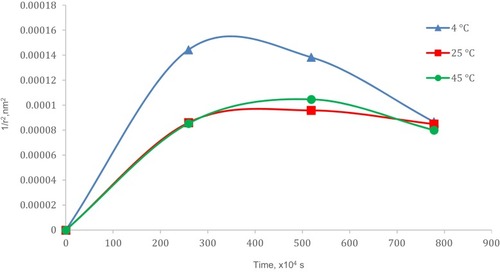
Figure 6 Ostwald ripening analysis.
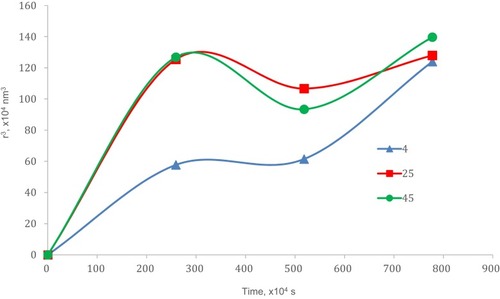
Figure 7 Graph cumulative percentage release GEM, %.
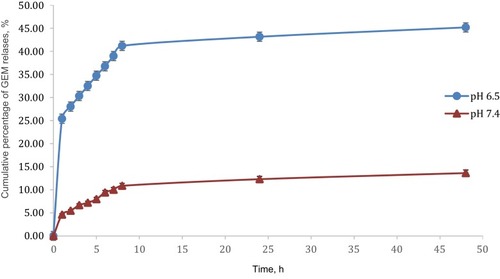
Figure 8 Graph of kinetic models, zeroth-order (A) first-order (B), Hixson-Crowell (C), Higuchi (D) and Korsmeyers-Peppas (E) for GEM release from optimized nanoemulsion in pH 7.4.
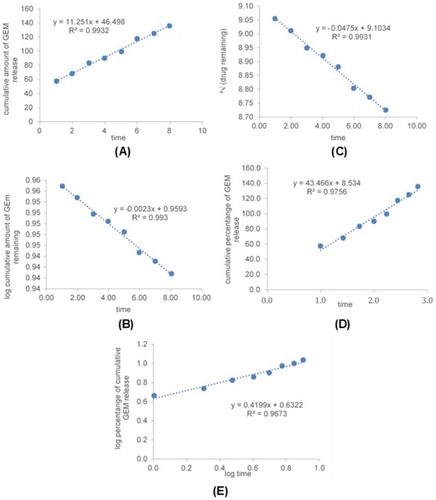
Figure 9 Graph of kinetic models, zeroth-order (A) first-order (B), Hixson-Crowell (C), Higuchi (D) and Korsmeyers-Peppas (E) for GEM release from optimized nanoemulsion in pH 6.5.
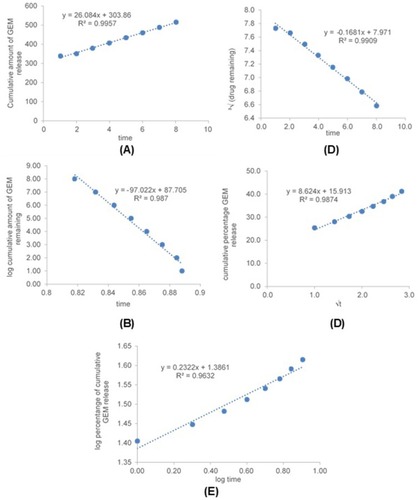
Table 7 The coefficient of determination (R2) of all kinetic models for GEM release from optimized nanoemulsion in pH 7.4 and pH 6.5
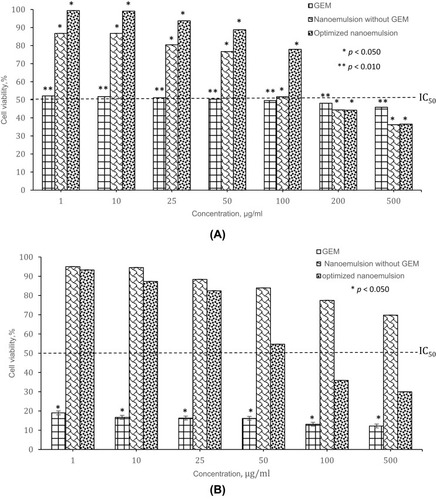
Table 8 IC50 values for cytotoxicity study
Figure 10 The cytotoxicity effect of different cell lines: (A) MRC5 lung cells, (B) A549 lung cancer cells at 72 h treatment.