Figures & data
Figure 1 HRTEM image showing flower-shaped gold nanoparticles produced by Bacillus RSB64.
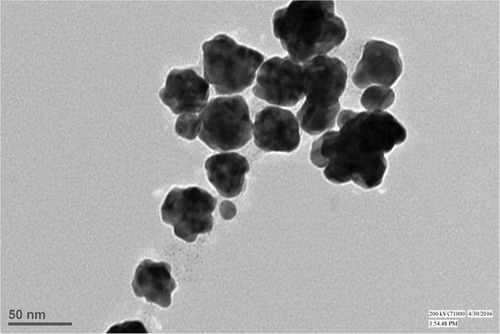
Figure 2 Effect of NADPH on the synthesis of gold nanoflowers.
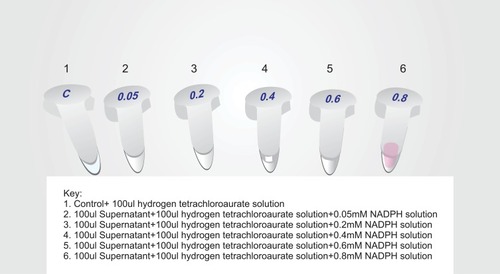
Figure 3 Visible spectra of biogenic gold nanoflowers and ciprofloxacin-bound gold nanoflowers.
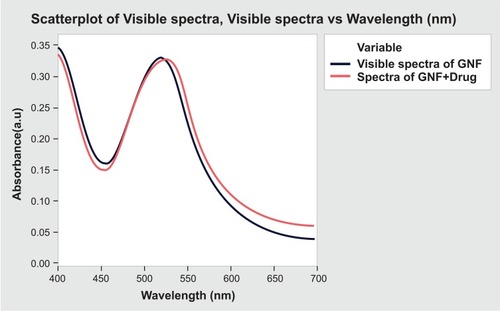
Figure 4 FTIR spectra of ciprofloxacin, biogenic gold nanoflowers, ciprofloxacin-bound gold nanoflowers.
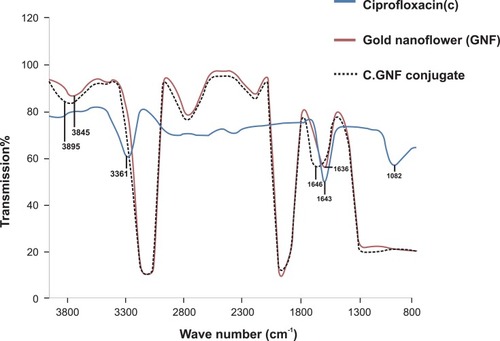
Figure 5 In vitro ciprofloxacin release from GNFs at pH ranging from 6 to 9.
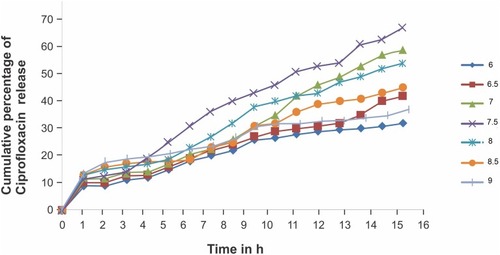
Figure 6 Kinetic analysis of drug release: (A) zero-order kinetics, (B) first-order kinetics, (C) Higuchi kinetics, (D) Kosermayer–Peppas plot.
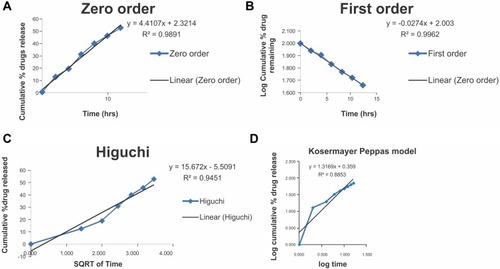
Figure 7 Plates showing antimicrobial activity of gold nanoflowers, drug alone and drug–GNF conjugate against (A) Pseudomonas sp. and (B) Bacillus subtilis.
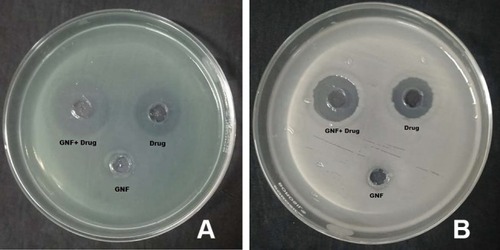
Figure 8 Graph showing the zone of inhibition of ciprofloxacin and ciprofloxacin–GNF conjugate against the bacterial strains tested.
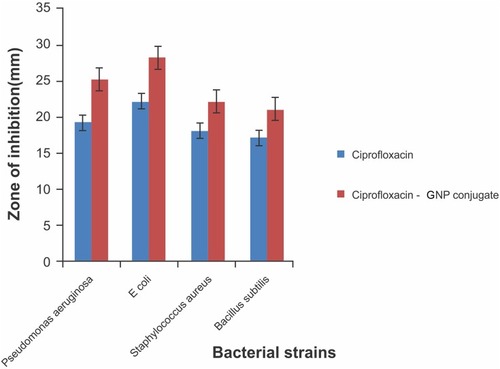
Table 1 Minimum Inhibitory Concentration of Ciprofloxacin and Ciprofloxacin-Bound Gold Nanoflowers Against the Bacterial Strains*
Figure 9 Graph showing percent survival of bacterial strains against ciprofloxacin and ciprofloxacin–GNF conjugate.
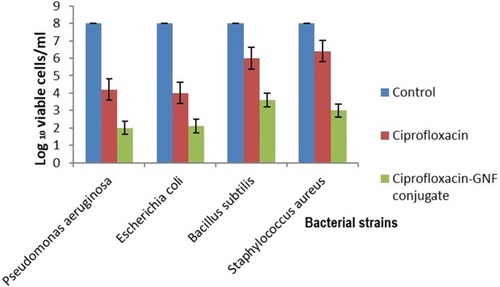
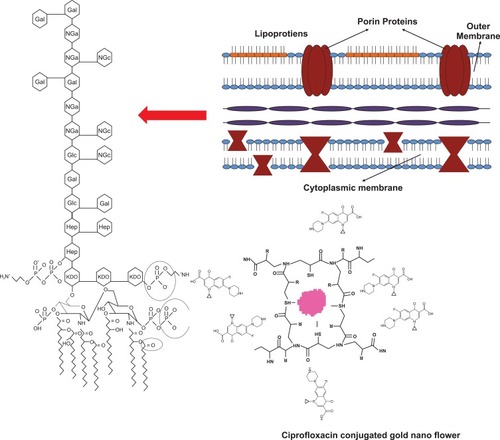
Figure 10 Schematic representation of the interaction between ciprofloxacin–GNF conjugates against Gram-positive cell wall.
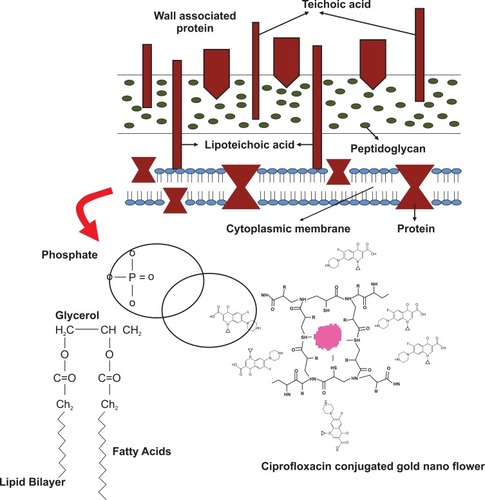
Figure 11 Schematic representation of the interaction between ciprofloxacin–GNF conjugates against Gram-negative cell wall.