Figures & data
Table 1 The Quality Control Criteria of EpiKutis® Model
Figure 1 Characterization of 3D EpiKutis® model. Histological examination (A), viability (B) and ET50 (C) analysis of EpiKutis model.
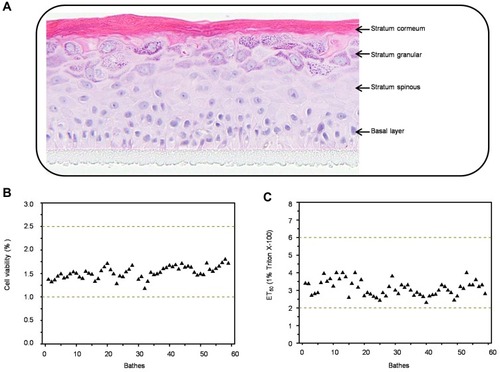
Figure 2 Physicochemical characterization of AgNPs. (A) The representative TEM image. (B-D) DLS, UV and XPS analysis of AgNPs, respectively.
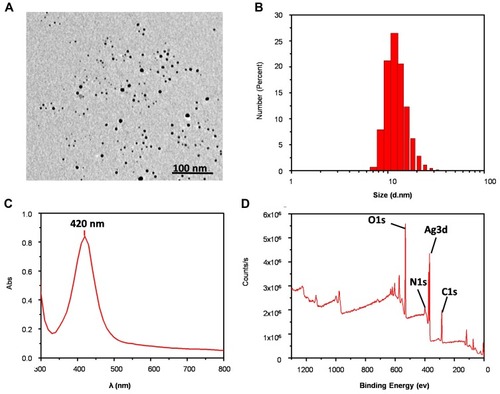
Figure 3 Toxic effects of AgNPs. Viability (A) and LDH content (B) of 3D EpiKutis® and 2D KC cells after treatment with AgNPs for 24 hrs at the equivalent concentration, as determined by MTT and LDH assays. (Mean±SD, n=3; *p<0.05 and **p<0.01 indicating the statistical difference between the groups of 2D KC cell; #p<0.05 and ##p<0.01 indicating the statistical difference between the groups of EpiKutis®).
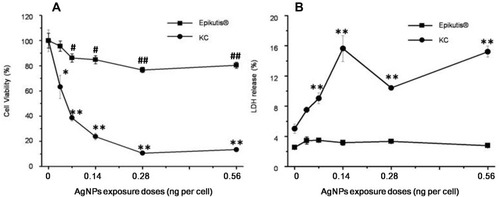
Figure 4 Silver content in the EpiKutis® model and 2D Keratinocytes after AgNPs exposure for 24 hrs at the equivalent dose of 0.28 ng per cell. (A) Silver content in EpiKutis model and 2D Keratinocytes. (B) Distribution of silver in the EpiKutis model (Mean±SD, n=3).
Abbreviations: UM, upper medium; BM, bottom medium.
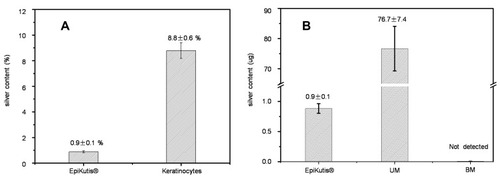
Figure 5 TEM imaging and EDS elemental graph of AgNPs. Figures (A, C) were the TEM images of the stratum corneum layer and cell layer of 3D EpiKutis® respectively, of which EDS energy peaks of the detected elements were shown in the figure (B, D) correspondingly. Figure (E) was the TEM image of 2D KC cells, of which EDS energy peaks of the detected elements were shown in the figure (G). Figure (F) was the magnified TEM dark-field image of the object in the square frame of figure (E). The 3D EpiKutis and 2D KC cells were exposed to the equivalent doses of 0.28 ng AgNPs per cell. The scale bar in the figure (F) was 200 nm, the scale bar in other figures was 500 nm.
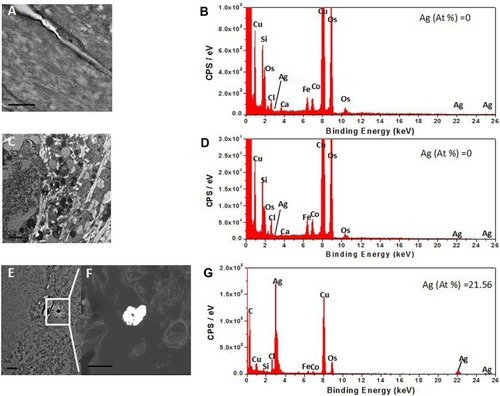
Figure 6 Oxidative stress analysis of EpiKutis® and KC cells. The relative level of ROS (A), MDA (B) and SOD (C) in 3D EpiKutis model and 2D KC cells after the treatment with AgNPs for 24 hrs at the equivalent dose of 0.28 ng AgNPs per cell. Ten millimolar N-acetylcysteine (NAC) was used as an antioxidant against oxidative damages (Mean±SD, n=3, *p<0.05, **p<0.01).
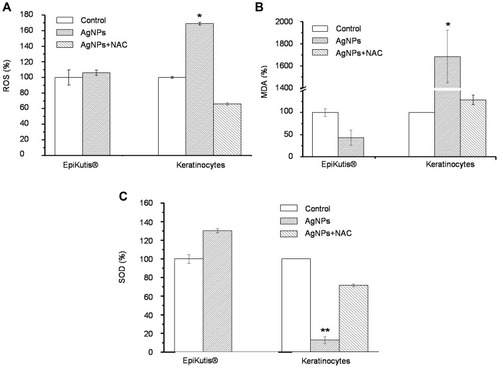
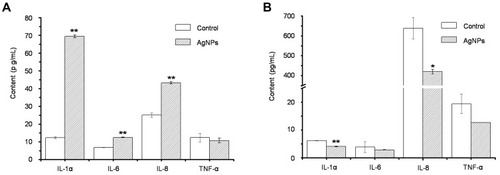
Figure 7 The release of inflammatory factors in 2D KC cells (A) and 3D EpiKutis® model (B) after the treatment with AgNPs for 24 hrs at the equivalent dose of 0.28 ng AgNPs per cell (Mean±SD, n=3, *p<0.05, **p<0.01).