Figures & data
Figure 1 Modification of natural polymer guar gum (GG). (A) Synthetic scheme of amination of GG. (B) FTIR spectra showing the successful modification of GG to aminated guar gum (AGG). (C) Degree of substitution in the polymer backbone by TNBS assay.
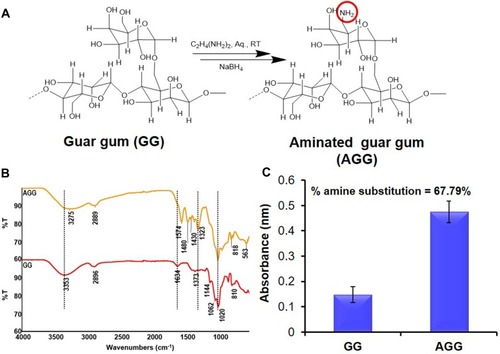
Figure 2 Characterization of AGG-assisted Ag NPs (Ag@AGG NPs). (A) Representative scheme of Ag@AGG NPs synthesis. (B) Characteristic UV peak of Ag NPs at 420 nm. (C and D) Representative TEM photomicrograph of Ag@AGG NPs reveals the size in the range of 6–12nm (scale bar = 50nm) and size distribution of Ag@AGG NPs by ImageJ software, respectively. Photomicrographs indicates a successful synthesis of Ag NPs having a spherical shape in nature. (E) DLS size distribution showing Ag@AGG NPs average diameter (217.1 ± 10nm).
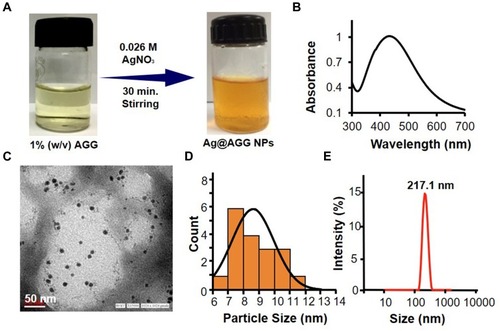
Figure 3 Synthesis and characterization of hydrogels and hydrogel patches. (A) Digital image of the various formulation showing the distinct color change with subsequent incorporation of the active materials. (B) EDAX analysis shows the chemical composition of HG-Ag-EGCG and Ag concentration in HG-Ag-EGCG was recorded to be 11.43%. (C) Swelling behavior of different hydrogel formulations. (D) Porosity of different hydrogel patches. (E) Young’s modulus reveals sufficient mechanical strength of hydrogel formulations concerning storage and loss modulus (mean ± SD, n = 3). Scale bar = 500 µm except for HG-Ag where it is 50 µm. (F) SEM photomicrographs show the flexible porous networks of different formulations. Ag NPs formation in HG-Ag hydrogel patch (Yellow arrows showing the Ag NPs in the inset image).
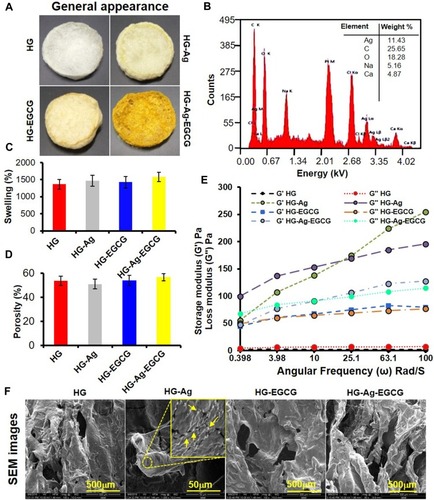
Figure 4 In vitro release of Ag and EGCG from HG-Ag-EGCG and their effect on biocompatibility. HG-Ag-EGCG was placed in DMEM culture medium to unloose its content. The media was aspirated at different time points (1, 3, 5, 8, 10, 15 days) and subjected to analyses. (A) AAS estimation of Ag content with a maximum concentration of 4.1 ppm. (B) UV analysis for EGCG release shows sustained release profile in aspirated media and ~80% of EGCG was released in 8th day which remains constant afterward. (C) MTT assay for cell viability on aspirated media treated normal skin MSC P5 cells indicates good biocompatibility of Hg-Ag-EGCG. (D) EGCG release kinetics from final formulation (Hg-Ag-EGCG) at a different time interval in PBS; pH 7.4 (mean ± SD, n = 3).
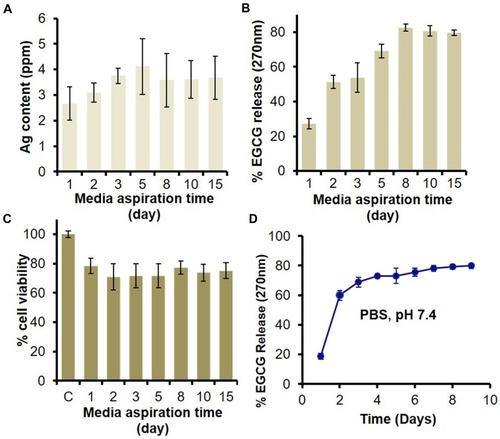
Figure 5 Antibacterial potency of different hydrogel patches. Digital image showing the antibacterial activity of different hydrogel patches against gram-negative (E. coli. and P. aeruginosa) and gram-positive (B. subtilis and S. Aureus) bacteria. (A) Zone inhibition assay (i = HG, ii = HG-Ag, iii = HG-EGCG, iv = HG-Ag-EGCG (10 ppm), v = HG-Ag-EGCG (50 ppm) treatment time 12hrs). (B) Growth curve analysis (treatment time 24hrs) for E. coli. and B. subtilis. Antibacterial activity data clearly indicate a potent antibacterial property of Hg-Ag-EGCG.
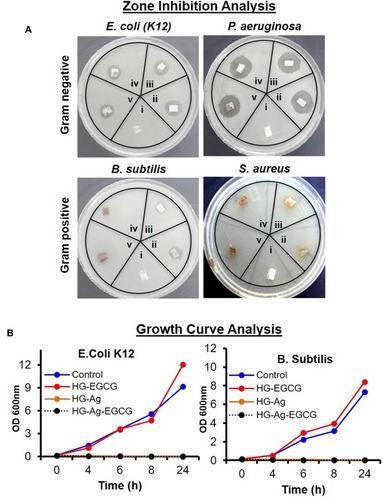
Figure 6 HG-Ag-EGCG’s procoagulation and in vivo wound-healing potential. (A) Digitals images of wounds post-treatment with Hg-Ag-EGCG and NeuSkin-F® compared to the negative control (bare wound). (B) Quantitative analysis of wound closure area on days 0, 9, 12 and 15th day post-treatment with different hydrogel nanocomposites (mean ± SD, n = 3, ***p<0.0001). It is to be noteworthy that the extent of wound closure in post-treatment with HG-Ag-EGCG hydrogel patch is superior compared to the commercially available wound patch (Images for confocal study were obtained at 20× magnification). (C) Blood cell coagulation effect of various wound patches.
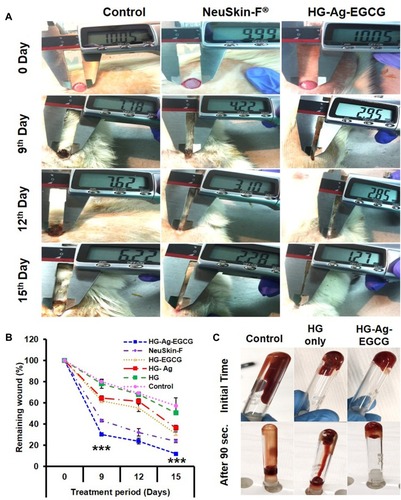
Figure 7 Cell proliferation ability of HG-Ag-EGCG. (A) Enhanced expression of KI 67 on hydrogel treated tissue sample (post 9-days treatment), examined by Immunohistochemistry under confocal microscopy. (B) Quantification data of the confocal image (n = 3, ***p<0.0005). It is to be noteworthy that the extent of wound closure in post-treatment with HG-Ag-EGCG hydrogel wound patch is superior compared to the control group wound patch (Images of confocal study were obtained at 20x magnification).
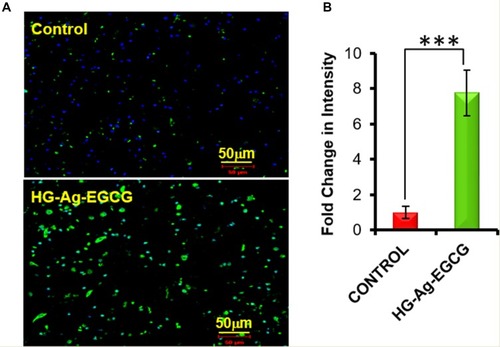
Figure 8 Effect of various hydrogel formulations on collagen synthesis and re-epithelialization. 12 days treated skin samples around the wound area were taken, and 5µ thin samples were cut by microtome for histo-pathological examination. (A) Representative photomicrographs of Masson trichrome-stained skin section showing enhanced collagen synthesis, firm-differentiated epithelium, and no visible inflammation or infection on HG-Ag-EGCG-treated sections while the control group showed more void spaces with loose crust. (B) Hematoxylin and eosin (H&E) stain shows HG-Ag-EGCG-exposed group has successful reepithelialization, granular tissue formation with enhanced neovascularization and densely packed keratinocytes (yellow arrows) (n = 3, scale bar 100 µm).
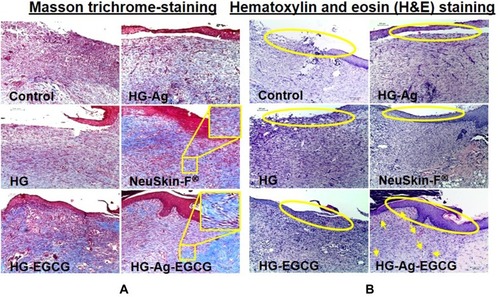
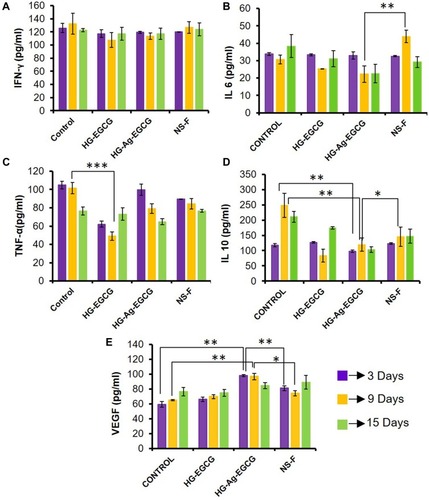
Figure 9 Effect of hydrogel patches on growth factor and cytokines. (A) Unaltered expression levels of IFN-γ secretion. (B and C) Inhibition of pro-inflammatory cytokines IL-6 and TNF-α secretion on treatment with HG-Ag-EGCG. (D) Significant changes found in anti-inflammatory IL-10 secretion on HG-Ag-EGCG treated group (E) Enhanced VEGF secretion on HG-Ag-EGCG treated group (n=3, ***p=0.0006, **p<0.005, *p<0.05).