Figures & data
Figure 1 Nanoparticle DDS in the pipeline for stroke therapy.
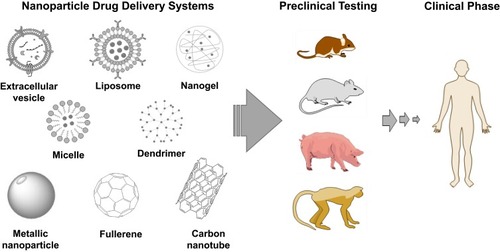
Table 1 Lipid-Based Carriers Used in Animal Models of Stroke, Categorized According to Surface Property and Therapeutic Cargo
Table 2 Alternative Nanoparticles Studied in Animal Models of Stroke, Categorized According to Carrier Material Composition and Functionalization
Figure 2 Distribution of nanoparticles used in animal models of stroke based on their compositions.
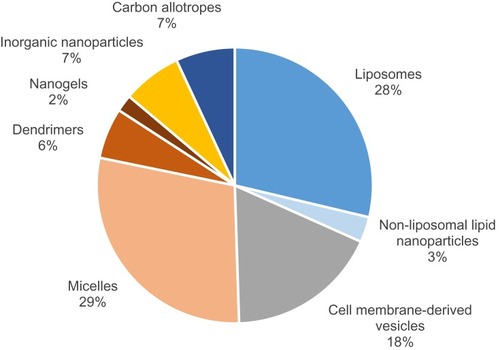
Table 3 Cell Membrane-Derived Vesicles Used in Animal Models of Stroke, Categorized According to Vesicle Type and Tissue of Origin; Exosomes Have Either Been Explicitly Described or Otherwise Inferred Based on Size and Protein Marker Detection
Figure 3 Temporal timeline of research interest for stroke with nanoparticles, expressed via in vivo study publication.
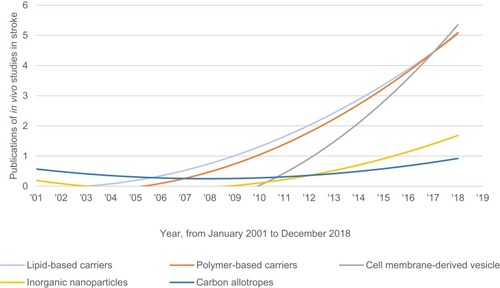
Figure 4 Therapeutic outcome measures for lipid-based carriers, polymer-based carriers and cell membrane-derived carriers (CMVs). (A) Bar chart of the absolute total for each outcome measured. Studies using both empty vehicle and free drug controls (red) are fewer than those using only one or neither of the controls (blue). (B) Radar chart of the percentage-weighted differences in the types of outcome measures used to show efficacy in vivo.
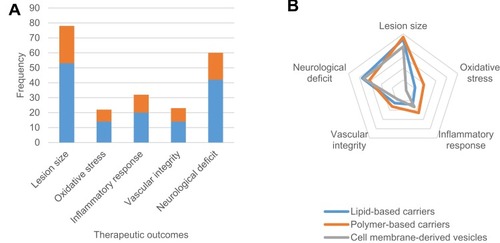
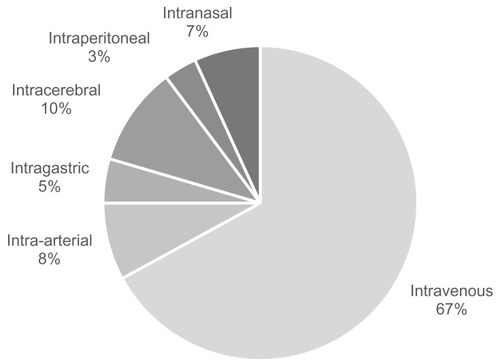
Figure 5 Distribution of routes of drug administration applied in animal models of stroke, for lipid-based carriers, polymer-based carriers and CMVs.