Figures & data
Figure 1 (A) UV-visible spectra of bare silver nanoparticles and capped with different amounts of PGA as capping agent, (B) Absorbance maximum displacement depending on the concentration of capping agent; (C) Increase of the absorbance maximum depending on the concentration of capping agent and (D) Stability of bare and PGA capped silver nanoparticles three months after synthesis.
Abbreviations: PGA, poly-α, γ, L-glutamic acid; AgNpPGA, PGA-capped silver nanoparticles.
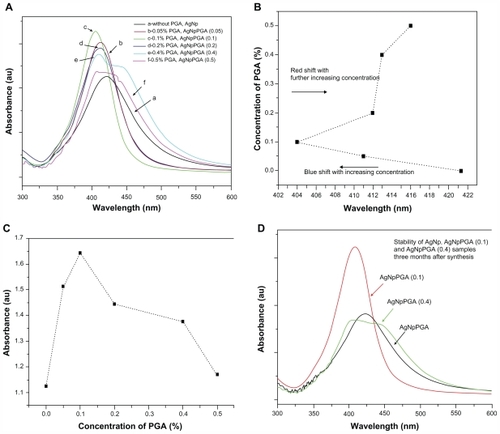
Table 1 Assignment, vibrational modes, and positions (wave number in cm−1) of FTIR bands in the spectra of PGA, AgNpPGA (0.1), and AgNpPGA (0.4)
Figure 2 Images of AgNp particles obtained in the experiment without PGA (A) and with 0.4% PGA (B).
Abbreviations: FESEM, field emission scanning electron microscope; PGA, poly-α, γ, L-glutamic acid
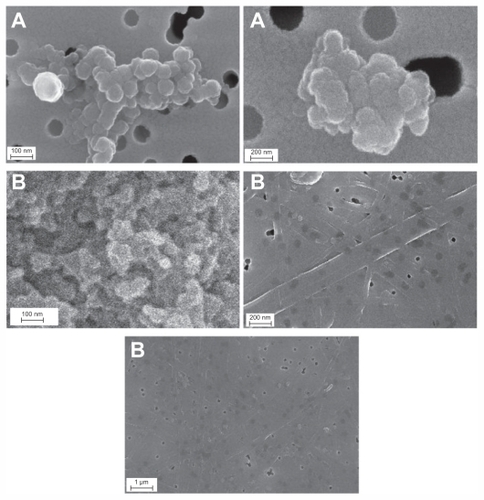
Figure 3 (A) Scheme of the green synthesis of the bare and capped silver nanoparticles. (B) FESEM images of capped silver nanoparticles with 0.1% PGA (inset shows arbitrarily magnified particle).
Abbreviations: AgNp, silver nanoparticles; FESEM, Field Emission Scanning Electron Microscope; PGA, PGA, poly-α, γ, L-glutamic acid.
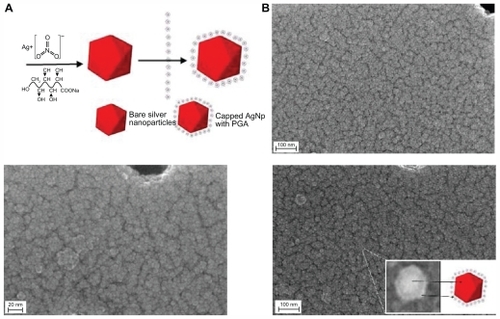
Figure 4 TEM images of bare silver nanoparticles (A), capped with 0.1% PGA (B) and with 0.4% PGA (C).
Abbreviations: TEM, transmission electron microscope; PGA, poly-α, γ, L-glutamic acid.
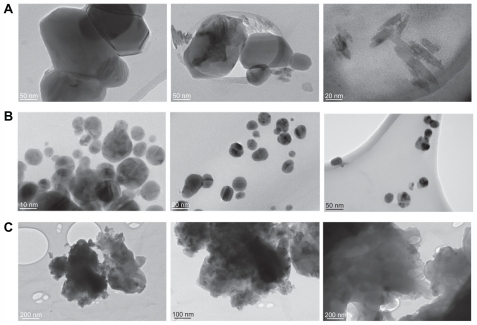
Figure 5 Scheme representing proposed formation of colloidal silver nanoparticles without PGA (A) with optimal (B) and excessive (C) concentration of PGA.
Abbreviation: PGA, poly-α, γ, L-glutamic acid.
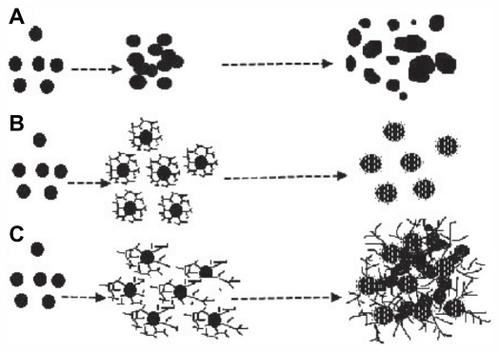
Table 2 Zeta potential results for bare and PGA-capped silver nanoparticles
Figure 6 Viability of HepG2 cells treated with AgNp or AgNpPGA (0.1) for 24 h. The data are presented as mean values of three independent experiments (each with five replicates) ±SD.
Note: *P < 0.05 statistically significant difference (ANOVA, Kruskal-Wallis).
Abbreviations: AgNp, silver nanoparticles; AgNpPGA, PGA-capped silver nanoparticles; SD, standard deviation; PGA, poly-α, γ, L-glutamic acid.
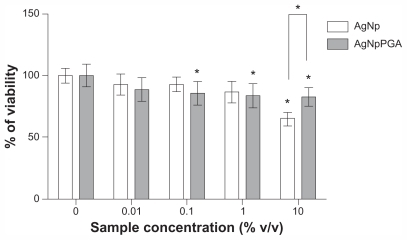
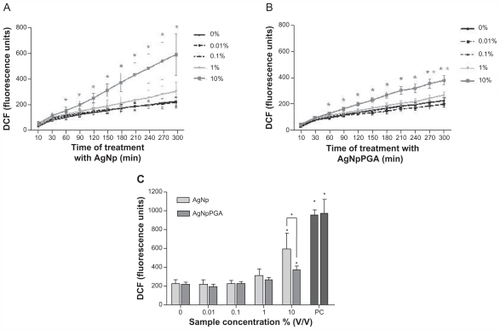
Figure 7 AgNp and AgNpPGA (0.1)-induced intracellular ROS formation in HepG2 cells. Kinetic of ROS formation during 5 hour exposure to AgNp or AgNpPGA (0.1) (A and B); each point represents the mean of five replicates (±SD) of representative experiment. Increase of DCFH fluorescence intensity in cells exposed to AgNp or AgNpPGA (0.1) after 5 hour exposure (C); each bar represent means (±SD) of three independent experiments. PC (0.5 mM t-BOOH).
Note: *P < 0.05; statistically significant difference (ANOVA, Kruskal-Wallis).
Abbreviations: DCF, 2-7-dichlorofluorescin; PGA, poly-α, γ, L-glutamic acid; AgNp, silver nanoparticles; AgNpPGA, PGA-capped silver nanoparticles; ROS, reactive oxygen species; DCFH, 2-7-dichlorofluorescin; SD, standard deviation; PC, positive control.