Figures & data
Figure 1 Characterization of ZnO NPs. Representative TEM images of 1mM ZnO NPs by magnification zoom of 30 k (A) and 100 k (B). The hydrodynamic diameter of 1 mM ZnO NPs in dd-water was 214.16 ± 0.31 nm, as measured by dynamic light scattering method (C). Zeta potential of 1 mM ZnO NPs in dd-water was −16.11 ± 0.46 mV (D). Data were presented as mean ± SE (n = 3).
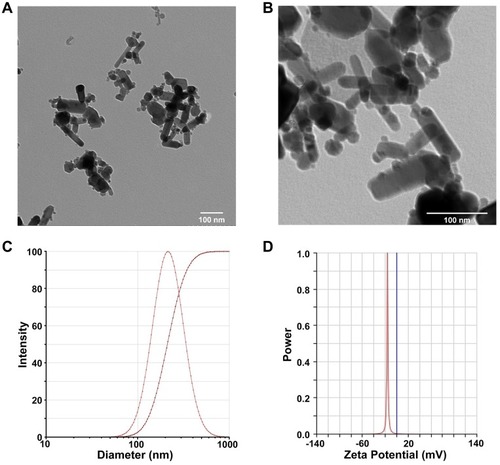
Figure 2 Differentiation and identification of hiPSC-CMs. Representative morphological images of hiPSCs after differentiation at day 0, 8, 14, and 25 (A, 10x). Stable beat of cardiomyocytes was confirmed by MEA (B).
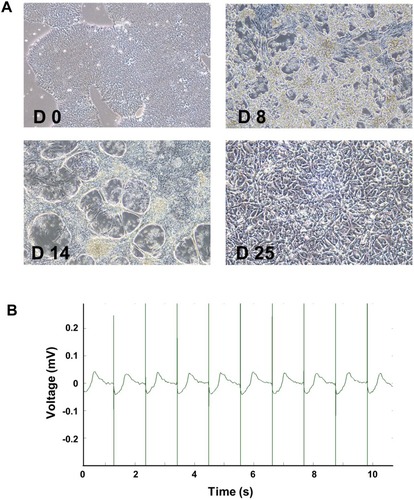
Figure 3 Non-cytotoxic concentrations of ZnO NPs induced electrophysiological alterations in hiPSC-CMs. HiPSC-CMs were treated with ZnO NPs at 10, 25, and 50 μM. At 0, 2, and 6 h, electrophysiological function was evaluated by analyzing beat rate, spike amplitude, and cFPD. Activity map (A, RPM) and quantitative analysis of beat rate (B). Activity map (C, mV) and quantitative analysis of spike amplitude (D). Beat waveform trace overlay to show FPD of 50 μM ZnO NPs treatment at 0, 2, and 6 h (E). Quantitative analysis of cFPD (F). The Data recorded at 0 h were used as baseline. Data were presented as mean ± SE (n = 3). *Compared with baseline (0 h), #Compared with control, P < 0.05.
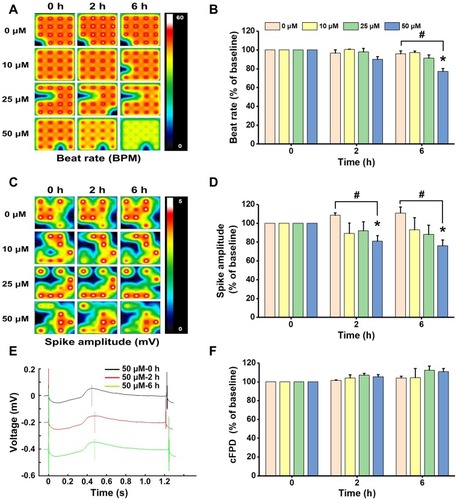
Figure 4 ZnO NPs concentration- and time-dependently induced cytotoxicity in hiPSC-CMs. Morphological images of hiPSC-CMs after treatment with different concentrations of ZnO NPs for 24 h (A, 10x). Cell viability was assayed after treatment with different concentrations of ZnO NPs for 24 h (B), and cell viability of the cells treated with 50, 200 μM ZnO NPs for indicated times up to 24 h (C). Concentration- and time-response of LDH release in the cells treated ZnO NPs (D, E). Data were presented as mean ± SE (n = 3). *Compared with control, P < 0.05.
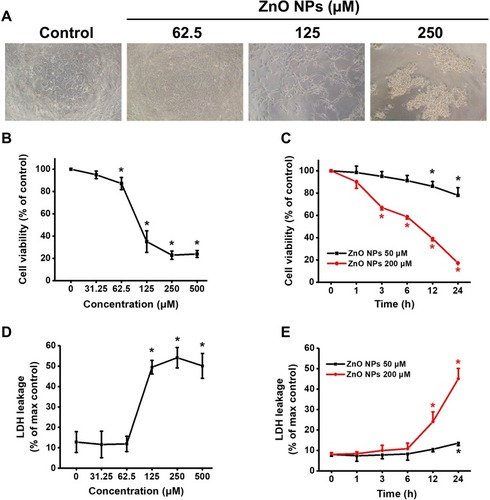
Figure 5 ZnO NPs induced ROS accumulation and MMP loss in hiPSC-CMs. HiPSC-CMs were treated with ZnO NPs at 0, 25, 50, and 100 μM for 6 h. Immediately after treatment, cells were stained with CM-H2DCFDA (green), TMRM (red), and Hoechst 33342 (blue) respectively for ROS, MMP and nucleus. Representative fluorescent images of the cells by high-content analysis (A, Scale bar = 50 μm). Quantitative analysis of ROS and MMP fluorescence intensity (B and C). Data were presented as mean ± SE (n = 3). *Compared with control, P < 0.05.
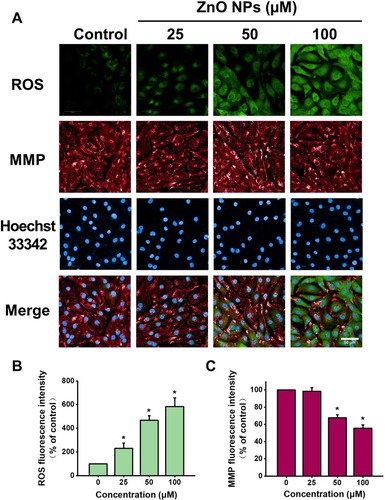
Figure 6 Effects of ZnO NPs on mitochondrial density and mtDNA copy number in hiPSC-CMs. HiPSC-CMs were treated with ZnO NPs at 0, 25, 50, and 100 μM for 6 h. Representative fluorescence images of the cells stained with Mito-Tracker (green) for mitochondria mass and Hoechst 33342 (blue) for nucleus (A, Scale bar = 50 μm), and quantitative analysis of Mito-Tracker fluorescence intensity (B). mtDNA copy number was determined by qPCR (C). Data were presented as mean ± SE (n = 3). *Compared with control, P < 0.05.
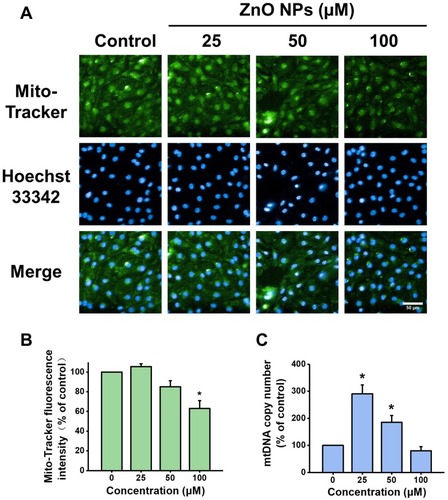
Figure 7 ZnO NPs inhibited PGC-1a pathway in hiPSC-CMs. HiPSC-CMs were treated with ZnO NPs at 0, 25, 50, and 100 μM for 6 h. Representative images of the protein expression of PGC-1α, TFAM, and COX IV detected by Western blot (A), and quantitative analysis (B–D). Data were presented as mean ± SE (n = 3). *Compared with control, P < 0.05.
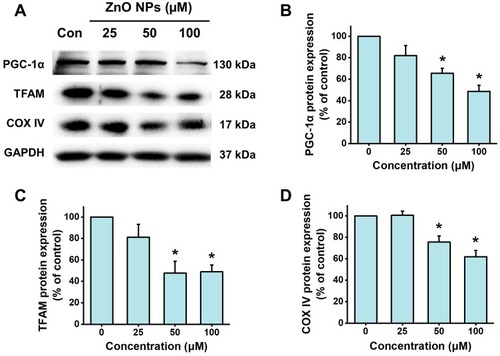
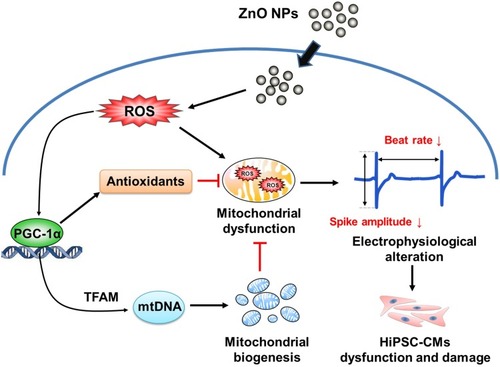
Figure 8 Schematic representation of the proposed mechanism underlying ZnO NPs-induced toxicity and dysfunction in hiPSC-CMs.