
Figures & data
Table 1 Primers for qRT-PCR
Figure 1 (A) SEM images of six sample surfaces. (B) The roughness of the five coatings (C) The frequency distribution of the pore size. (D) The pore size of the five coatings.
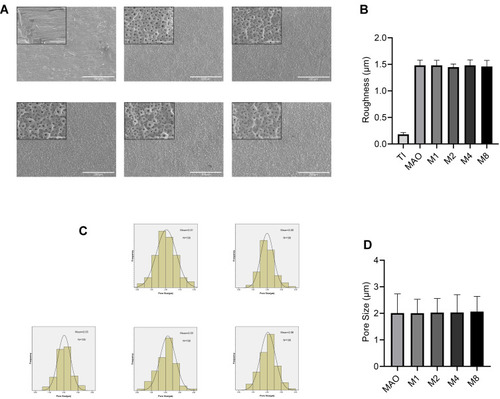
Figure 2 The contact angle of the six sample (*p<0.05 compared with Ti).
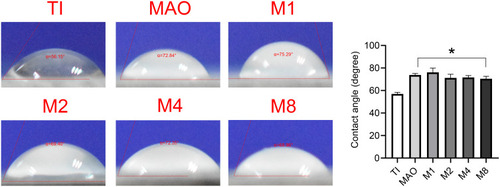
Figure 3 EDS and elemental analysis of the six sample.
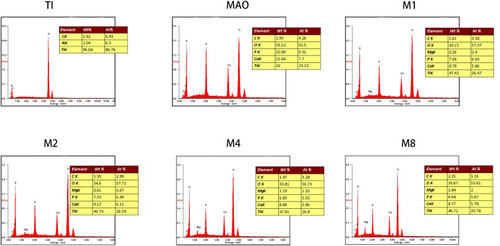
Figure 4 ICP detection of magnesium ion release from various coatings.
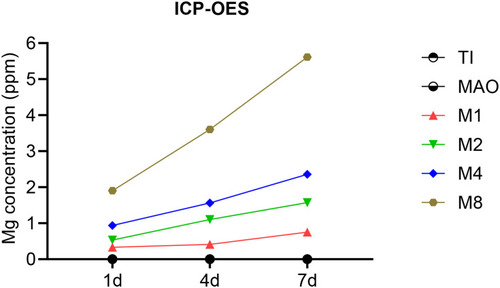
Figure 5 (A) Live/dead assay of cells cultured for 24 h on the samples. Scale bar = 100 μm. (B) Statistical results of the live/dead assay. (C) Cell proliferation measured by CCK-8 assay after 1, 3, and 7 days of culture. (D) Fluorescence images of actin (red) and nuclei (blue) in cells cultured on the samples for 6 h. Scale bar = 100 μm. (E) The average area of cell actin was determined by ImageJ (*p<0.05 compared with Ti and MAO; #p<0.05 compared with TI, MAO, M1, M4, and M8).
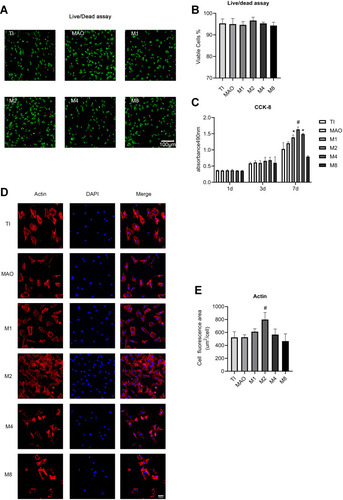
Figure 6 ALP activity and calcium deposition. (A) After 7 days of culture, BMSCs on the different coatings were stained with ALP. (B) ALP activity was measured was assayed using a quantitative colorimetric assay. (C) After 21 days of culture, BMSCs on the different coatings were stained with ARS. (D) Calcium deposition activity was assayed using a quantitative colorimetric assay (*p<0.05 compared with Ti and MAO; #p<0.05 compared with TI, MAO, M1, M4, and M8).
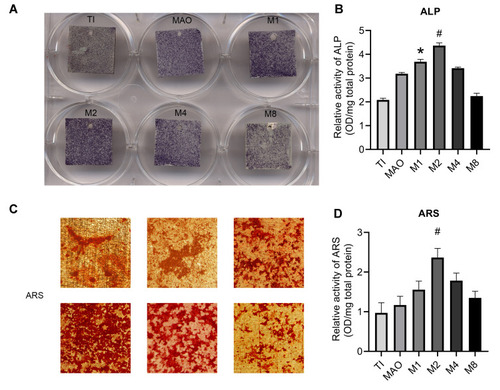
Figure 7 Expression of osteogenic-related genes was measured by qRT-PCR after incubating on different coatings for 7 days (n=3). (A) Runx2 expression. (B) ALP expression. (C) OCN expression (*p<0.05 compared with Ti and MAO; #p<0.05 compared with TI, MAO, M1, M4, and M8).
