Figures & data
Figure 1 Scheme of the PEG-BSA-AgNP/ICG-based photothermal cancer therapy. The encapsulation of indocyanine green (ICG) in PEGylated BSA-coated silver nanoparticles could provide an enhanced photo and plasma stability for ICG, leading to successful inhibition of tumor growth with local laser irradiation to the tumor site.
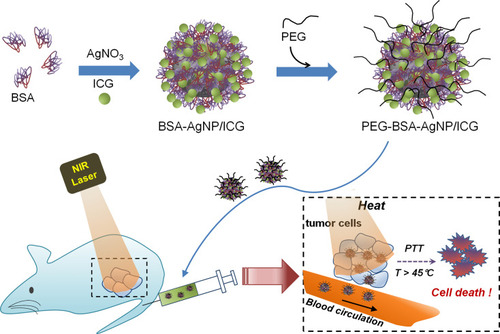
Figure 2 Physical characterization of the PEG-BSA-AgNP/ICG. (A) Representative transmission electron microscopic images of the PEG-BSA-AgNP/ICG. (B) The mean hydrodynamic size of PEG-BSA-AgNP/ICG by dynamic light scattering. (C) Size stability of the PEG-BSA-AgNP/ICG. (D) UV/VIS spectrophotometry of PEG-BSA-AgNP/ICG.
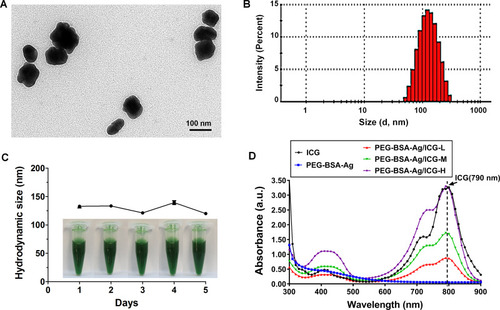
Figure 3 FT-IR data for the PEG-BSA-AgNP/ICG. The PEG-BSA-AgNP/ICG spectrum showed the characteristics peaks of BSA and PEG. The peaks at 613 and 1100 cm−1 were attributed to the lysine residues in BSA and the stretching vibration of “-C–O-C-” in the PEG.
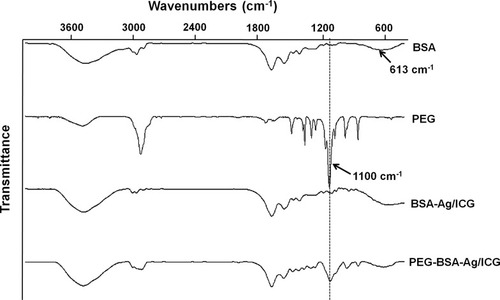
Figure 4 In vitro evaluation of the photothermal activity of the PEG-BSA-AgNP/ICG. (A) Temperature-versus-time profiles of the free ICG solution (at 5–30 μg/mL) after laser irradiation at 1.3 W. (B) Temperature-versus-time profiles of the PEG-BSA-AgNP/ICG dispersion (at 10–50 μg/mL as ICG) after laser irradiation at 1.3 W. (C) Temperature-versus-time profiles of free ICG, PEG-BSA-ICG mixture, and PEG-BSA-AgNP/ICG dispersion by laser irradiation at 1.3 W for three repeating cycles of a switch “on and off” mode. (D) UV-VIS spectra of ICG, PEG-BSA-ICG, and PEG-BSA-AgNP/ICG, before and after laser irradiation for 20 min.
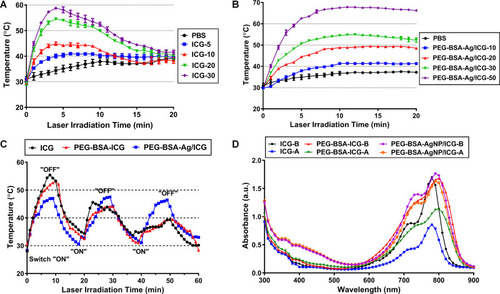
Figure 5 Cellular analysis of the anti-tumor activity of PEG-BSA-AgNP/ICG-based photothermal therapy. (A) Anti-tumor activity of Ag+ and PEG-BSA-AgNP/ICG on B16F10 cells. The B16F10 cells were treated with varying concentrations of either Ag+ or PEG-BSA-AgNP/ICG (10−8 – 10−2 M as Ag) and then, after 48 h incubation, the relative cell viability was determined using WST-1 assay. (B) Cytotoxicity of PEG-BSA-AgNP/ICG on B16F10 cells with photothermal treatment (PTT) at maximum medium temperatures of 40, 45, or 50°C. The statistically significant differences in the cytotoxicity levels were compared by 1-way ANOVA and post hoc Tukey’s multiple comparison test. *P < 0.05 vs PBS control, †P < 0.05 vs PEG-BSA-AgNP/ICG-treated cells without laser irradiation.
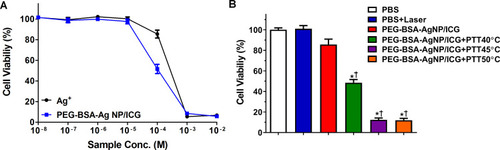
Figure 6 Pharmacokinetic profiles of PEG-BSA-AgNP/ICG. ICR mice (N = 5) were administered with either BSA-Ag/ICG or PEG-BSA-Ag/ICG via tail vein injection at doses of 12 mg/kg as ICG. After then, blood was collected at pre-determined time points (0, 0.5, 1, 2, 4, and 6 h post-administration), and the plasma concentrations of ICG were quantified by measurement of the absorbance at 790 nm.
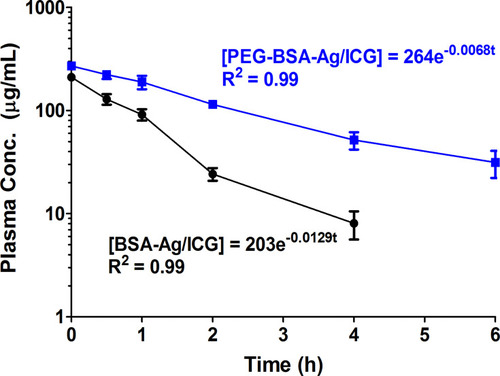
Figure 7 Biodistribution of PEG-BSA-AgNP/ICG in B16F10 in s.c. syngeneic tumor-bearing nude mice. (A) When the average tumor size reached 300 mm3, B16F10 s.c. syngeneic tumor-bearing mice were administered with PEG-BSA-AgNP/ICG (12 mg/kg as ICG) via tail vein injection. At 4 h post-administration, the mice were euthanized and the major organs (kidney, tumor, lung, spleen, heart, and liver) were harvested. The fluorescent images of the mice organs were acquired using FOBI Fluorescence In Vivo Imaging System (NeoScience Co., Ltd., Republic of Korea) (B) The ICG contents in the tissues were quantified by measuring the absorbance at 790 nm after the homogenization of the tissues. (C) Distribution profiles of silver in liver, kidney and urine at 12 h-post administration of PEG-BSA-AgNP/ICG.
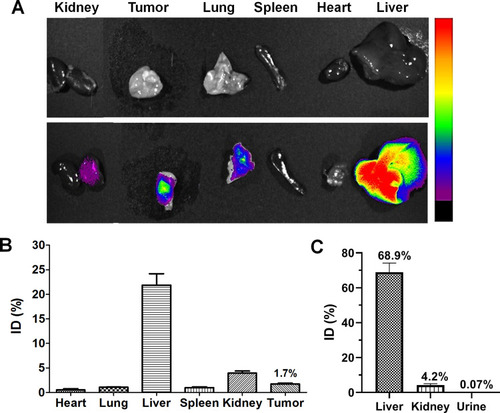
Table 1 Tumor Temperature Monitored for B16F10 S.c. Syngeneic Tumor Mouse Models at 4h Post-Administration of PEG-BSA-AgNP/ICG Using an Infrared Camera (E5, FLIR Systems) with Varied Laser Outputs
Figure 8 In vivo evaluation of the photothermal activity of PEG-BSA-AgNP/ICG in B16F10 s.c. syngeneic tumor mouse model. When the average tumor size reached 300 mm3, B16F10 tumor-bearing nude mice (N = 5) were administered with PEG-BSA-AgNP/ICG (12 mg/kg as ICG) via tail vein. At 4 h post-administration, the mice were anesthetized with ketamine/xylazine mixture, and then the tumors were irradiated for 20 min with a diode laser (λ = 885 nm) at varying laser output (0.5–0.95 (W). The highest temperature of the tumor surface was monitored using an infrared camera (E5, FLIR Systems).
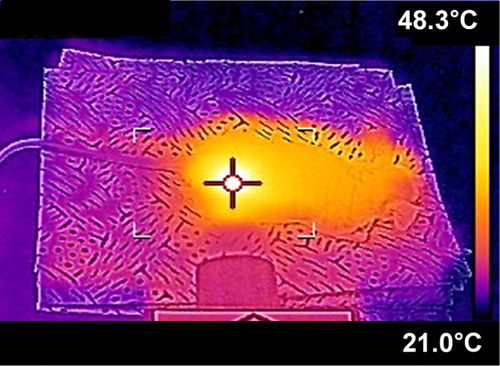
Figure 9 In vivo evaluation of the therapeutic efficacy of PEG-BSA-AgNP/ICG-based photothermal therapy using B16F10 s.c. syngeneic tumor mouse model. (A) Tumor growth profiles. When the average tumor size reached 100 mm3 (at day 4; 4 days after tumor implantation), B16F10 s.c. xenograft tumor mice were randomly divided into 4 groups: 1) PBS, 2) PBS+PTT, 3) PEG-BSA-AgNP/ICG, and 4) PEG-BSA-AgNP/ICG+PTT. The mice were treated once at day 4 and administered with the samples via tail vein injection. Specifically, for groups 2 and 4, at 4 h post-administration, laser was locally irradiated at the tumor site at 0.9W output for 20 min. On day 11 when the average tumor size of PBS-control mice reached 1000 mm3, the study was terminated. (B) Bodyweight changes of the mice. The mice in all groups gained weight during the study and there were no significant differences among the average bodyweights of the groups. The statistically significant difference in the body weight changes among the groups was compared by 1-way ANOVA and post hoc Tukey’s multiple comparison test. *P < 0.05. (C) Representative histological images of the tumor sections. Compared with the tissue sections in other groups, a marked loss of cells was observed from the PEG-BSA-AgNP/ICG-treated mouse tumor.
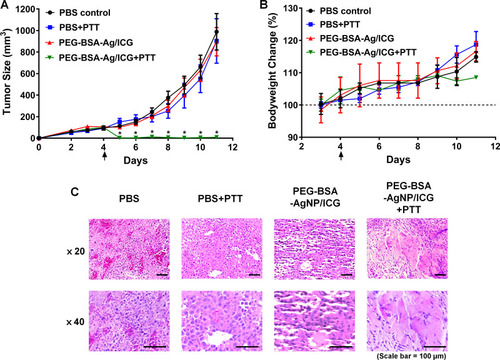
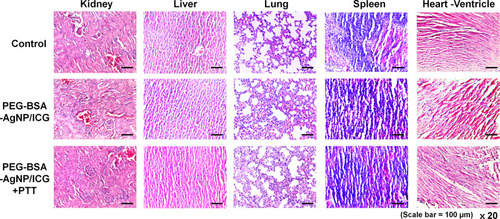
Figure 10 Histological analysis of the nontumorous major organs. After the efficacy study was terminated, the mice were sacrificed and the major organs (kidney, liver, lung, spleen, and heart) were harvested. The paraffin-embedded tissue sections stained with hematoxylin and eosin (H&E) showed no obvious signs of toxicity in organs of all the mice.