Figures & data
Figure 1 Color change of the reaction solution from light yellow to dark brown after 2 h indicates the formation of PF@AgNPs.
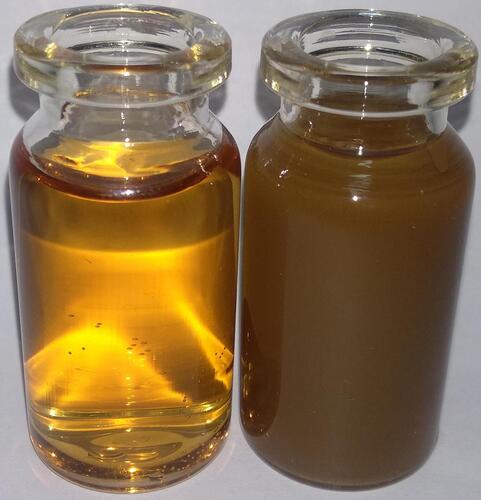
Figure 2 UV-Vis analysis of P. frutescens leaf extract and PF@AgNPs. UV-Vis spectrum of PF@AgNPs showed surface plasmon resonance peak at 461 nm.
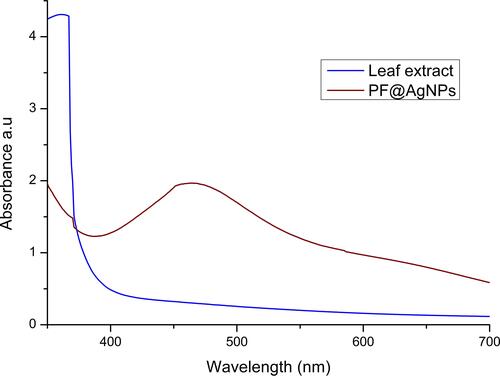
Figure 3 Schematic diagram represents the possible mechanism of plant-mediated synthesis (phytosynthesis) of AgNPs.
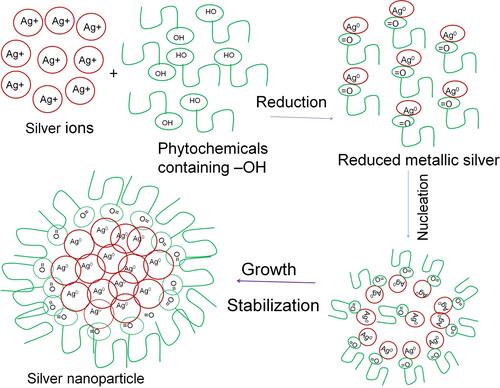
Figure 4 FTIR analysis of (A) P. frutescens leaf extract and (B) PF@AgNPs.
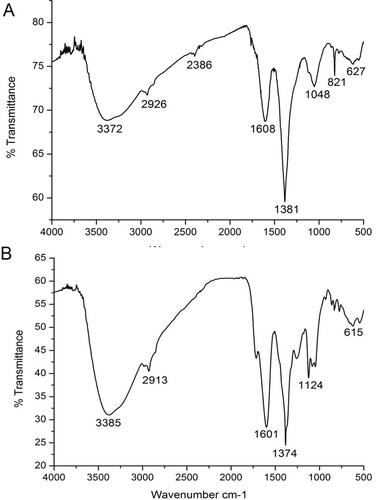
Figure 5 XRD pattern of PF@AgNPs.
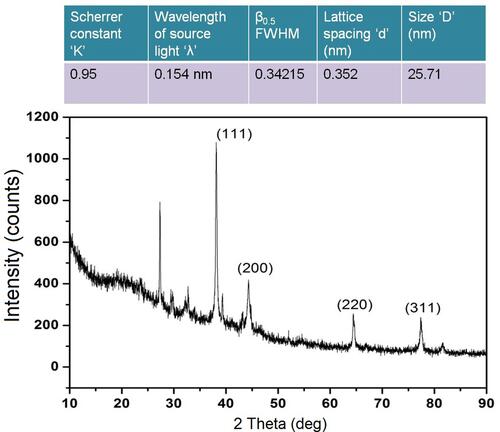
Figure 6 TEM analysis PF@AgNPs (A) TEM micrograph at 100 nm shows monodispersed AgNPs with different shapes including spherical, rod, triangle, and rhombic; (B) rod-shaped, rhombic shaped, and spiral-shaped AgNPs observed at 50 nm scale; (C) triangle, rhombic and spherical shaped AgNPs at 50 nm; (D) rod-shaped and triangle-shaped AgNPs at 20 nm; (E) spherical shaped AgNPs at 20 nm; (F) SAED pattern of AgNPs.
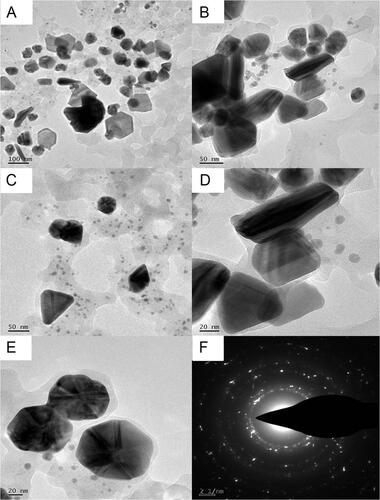
Figure 7 Zeta potential measurement of PF@AgNPs.
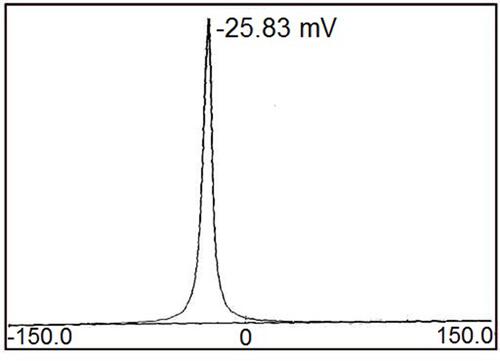
Figure 8 TG and DTG analysis PF@AgNPs.
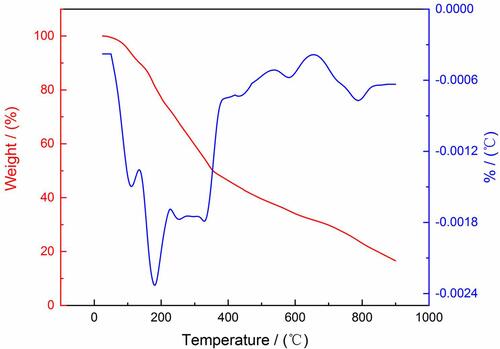
Figure 9 Antibacterial activity of PF@AgNPs against (A) S. aureus, (B) B. subtilis, and (C) E. coli; PTLE indicates pristine leaf extract; Ab indicates antibiotic; DMSO indicates dimethyl sulfoxide.
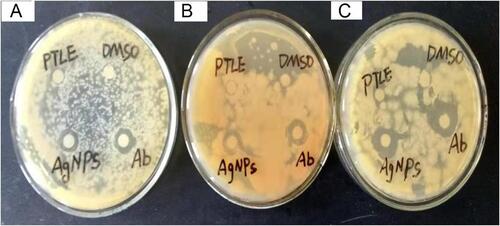
Figure 10 Comparison of antibacterial activity of pristine leaf extract (PTLE), PF@AgNPs and standard antibiotic streptomycin. Results were expressed as mean ± SD (n=3). Different lowercase letters above the bars indicate significant differences (P < 0.05) by SPSS test.
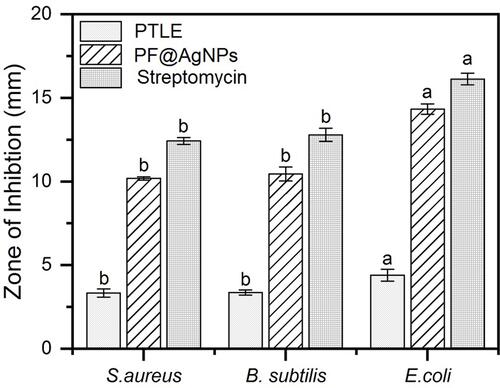
Figure 11 Scheme represents the possible mechanism of antibacterial activity of AgNPs.
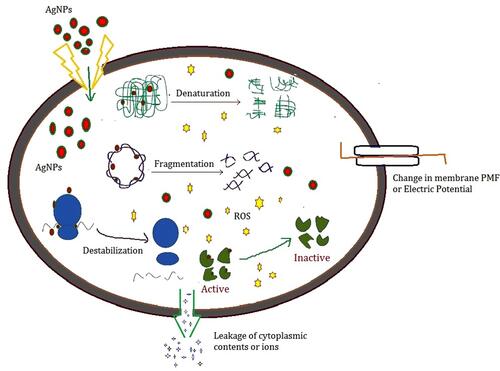
Figure 12 Antioxidant activities of PTLE, PF@AgNPs and ascorbic acid (A) DPPH radical scavenging activity, and (B) ABTS radical scavenging activity. All the data were represented as mean ± SD (n =3) in the form of bar graph. Data were analyzed by one-way analysis of variance (ANOVA, P < 0.05). Different lowercase letters above the bars indicate significant differences (P < 0.05).
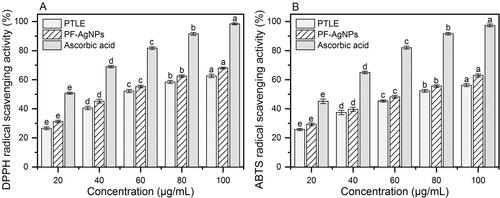
Figure 13 Dose-dependent cytotoxic effects of PF@AgNPs against human colon carcinoma (COLO205) and prostate carcinoma (LNCaP) All the data were represented as mean ± SD (n =3) in the form of bar graph. Bars with different superscripts indicate significant differences (P < 0.05).
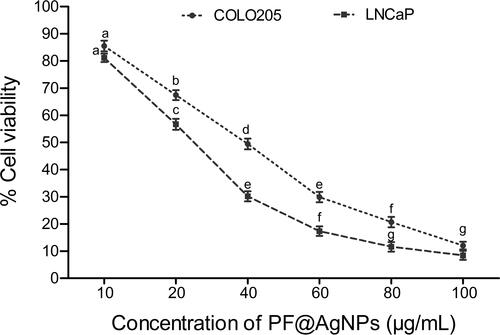
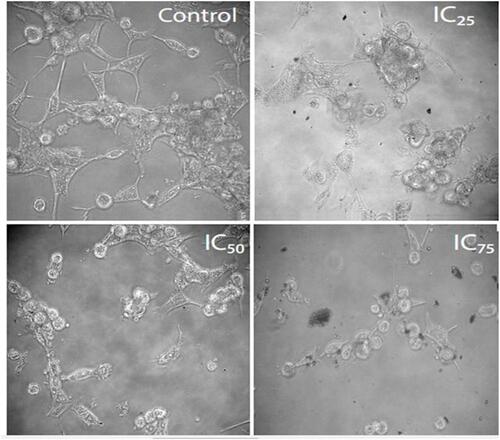
Figure 14 Anticancer activity of PF@AgNPs against LNCaP cell lines. The effects of PF@AgNPs on morphological changes of LNCaP cells were studied after 24 h exposure at different concentrations. PF@AgNPs affected the cell viability by inducing apoptotic symptoms, including warping of cells, rounding of cells, membrane blebbing, and cell shrinkage.