Figures & data
Figure 1 The assessment of body weight and the heart coefficient ratio. (A) Body weight of all four groups of rats was recorded twice a week, which increased in a similar trend. (B) The heart coefficient ratio was calculated and analyzed. Groups with no label on the top indicate no significant difference (P>0.05) when compared among the groups.
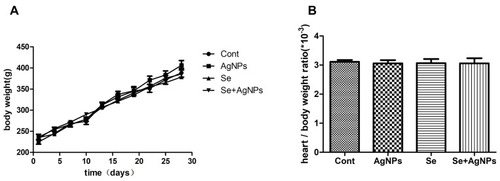
Table 1 Echocardiography Measurements in Rats Treated with or Without AgNPs and Selenite
Table 2 Hemodynamics Measurements in Rats Treated with or Without AgNPs and Selenite
Figure 2 Assessment of cardiac function by echocardiography and invasive hemodynamics. (A) Representative M-mode echocardiograms images were captured in each rat. (B) Representative left ventricular pressure diagrams were recorded in each group.
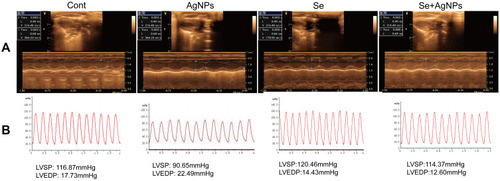
Figure 3 Ultrastructural changes of heart tissue observed by 10,000×TEM. Sarcomere and myofilament were observed. After exposure of AgNPs, fragmentation and lysis of the myofibrils and disarray of the sarcomere were found.
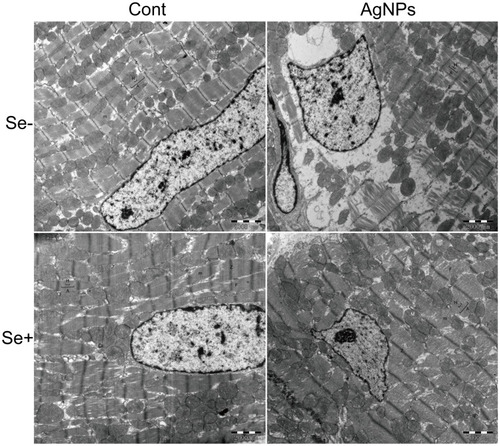
Figure 4 Ultrastructural changes of myocardial capillaries observed by 20,000×TEM. (A) Ultrastructural changes in myocardial capillaries and their endothelial cells. (B) The summarized bar graph showing the relative luminal area and the relative nuclear area.
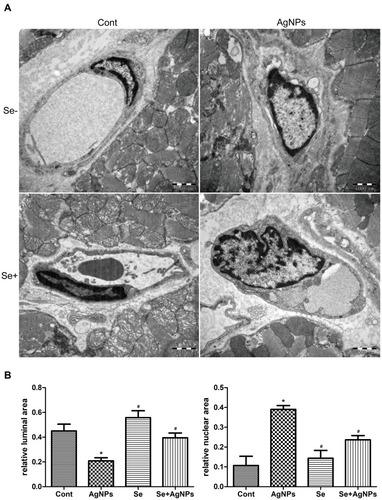
Figure 5 Ultrastructural changes of mitochondrial morphology and the mitophagy. (A–D) representative images showing mitochondrial morphology from (A) control, (B) Se-treated, (C) AgNPs-treated and (D) Se+AgNPs cotreated group; Green arrows denote silver nanoparticles within the mitochondria and yellow for outside. (E and F) representative images showing mitophagy in (E) AgNPs-treated and (F) Se+AgNPs cotreated group. Red arrows denote mitophagy.
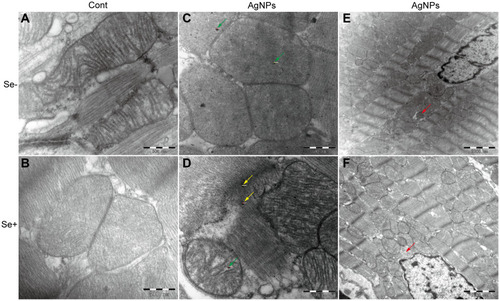
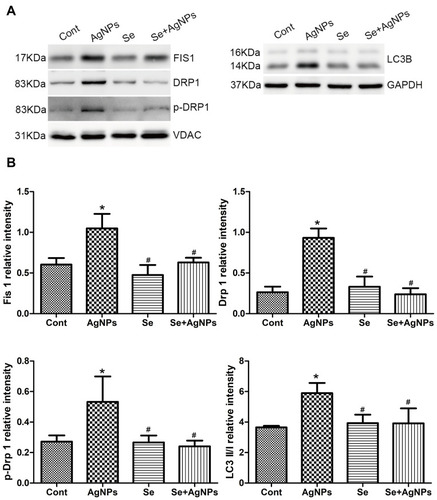
Figure 6 Western blotting of mitochondrial fission and autophagy markers. (A) The representative Western blot showing Drp1, p-Drp1, Fis1 and LC3B levels. VDAC and GAPDH served as the internal loading control for mitochondrial and whole protein, respectively. (B) The bar graph showing semiquantitative band intensity ratio from Drp1, p-Drp1, Fis1 to LC3B.