Figures & data
Figure 1 Physical characterisation of gold nanoparticles. Scanning electron microscopy images of gold nanoparticle (scale bar: 250 nm) and transmission electron microscopy (scale bar: 25 nm).
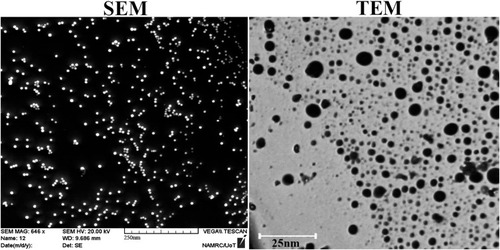
Figure 2 Characterization of of the synthesised compounds. (A) UV-VIS spectroscopy analysis of linalool, gold nanoparticles, LG, and LGC. (B) Drug release profile of LG and LGC.
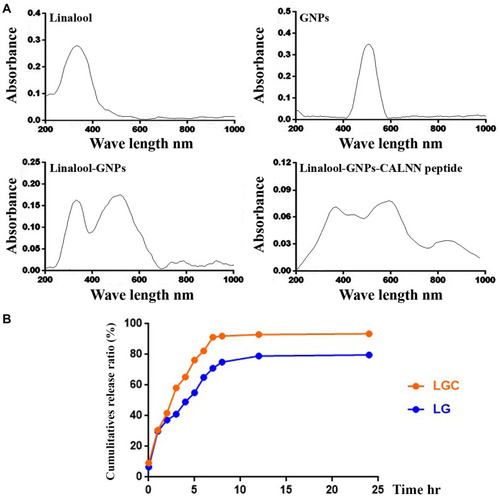
Figure 3 Antioxidant activity of the synthesised compounds. Upper lane represented the antioxidant percentage and Lower lane represented the principle of each assay. The results are represented as the mean ± SD. Asterisks indicate statically different, *p≤0.05, **p≤0.01, ***p≤0.001.
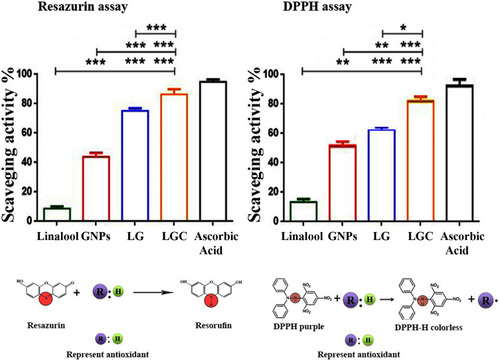
Figure 4 Antiproliferative activity of test compounds against SKOV-3 cell line. (A) Representative proliferation assay by CellTrace™, Each peak represents the cell division and consequently dilution of CellTrace into the cytoplasm. (B) Cytotoxic effect of tested compound on SKOV-3 human ovarian carcinoma cells after 48 h. (C) Colony-forming unit of SKOV-3 cell line treated as indicated for 24 h. The results are represented as the mean ± SD. Asterisks indicate statically different from control, **p≤0.01, ***p≤0.001, ****p≤0.0001.
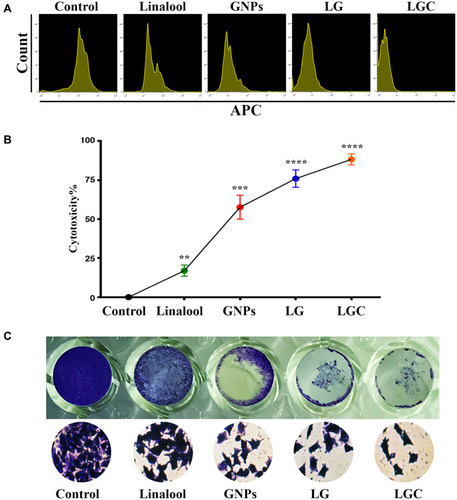
Figure 5 Apoptosis markers in treated SKOV-3 cells following treatment with tested compounds as indicated. (A) Microscopic tracking of nuclear morphology by staining of DAPI (nucleus), treated cells with LG and LGC increased the fluorescent intensity of nuclear. (B) SKOV-3 cells treated as indicated. Untreated cells are shown normal structure of cell without significant apoptosis or necrosis, after treated, apoptosis features including blebbing and chromatin condensation were observe, and can see red color that detect the apoptosis. (C) Flow cytometric analysis of early and late apoptosis. The treated cell were analyzed after staining with FITC-conjugated AV and PI by flow cytometer. Chart bar represented % of apoptosis rate in SKOV-3 cells after treated as indicated. The results are represented as the mean ± SD.
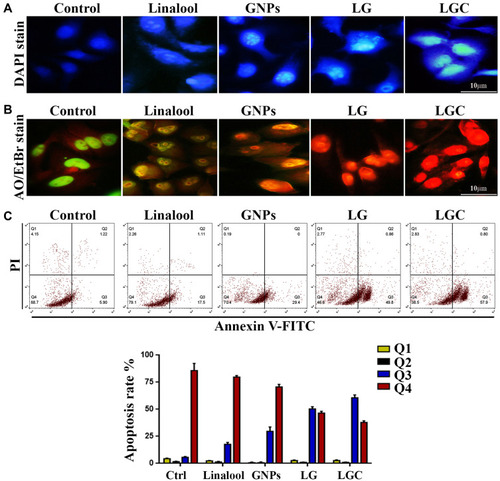
Figure 6 Genotoxicity of compounds in SKOV-3 cells. The upper panel show comet assay, which used to determine the different levels of DNA damage (long tail) in SKOV-3 cell line following treatment as indicated. Lower Panel showed DNA damage induced by tested compounds in SKOV-3 cell line was characterized by the percentage of DNA tail and tail length. The results are represented as the mean ± SD. Asterisks indicate statically different from control untreated cells, *p≤0.05, **p≤0.01, ***p≤0.001, ****p≤0.0001. DNA electrophoresis of SKOV-3 treated with tested compound as in indicated.
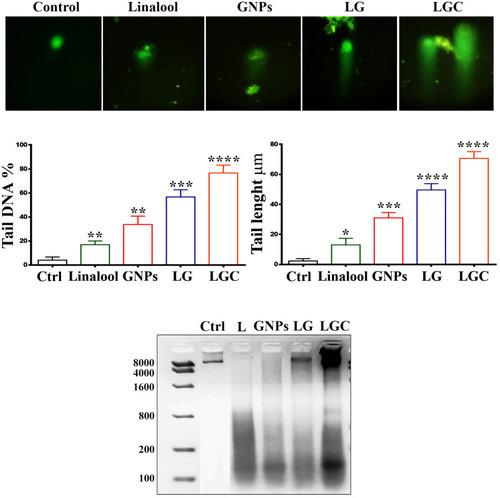
Figure 7 ROS Generation in SKOV-3 cells. Generation of ROS in SKOV-3 cells following treatment as indicated. Bar chart represents quantification of DHE fluorescence intensity at different treatment as indicated. The results are represented as the mean ± SD. Asterisks indicate statically different from control untreated cells, *p≤0.05, ***p≤0.001, ****p≤0.0001. DHE fluorescence folding increased when cells were treated with LG, and LGC. The yellow staining of nuclei refer to increased of the intracellular production of ROS. Scale bar 50µm.
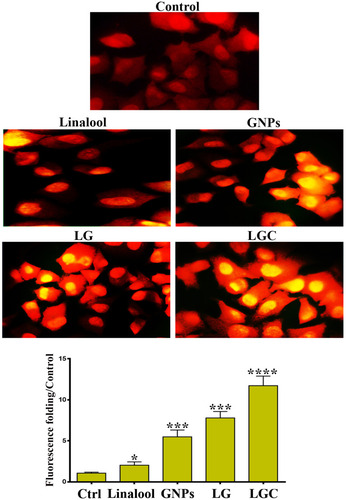
Figure 8 Detection and quantification of cellular uptake of FITC-labeled LG and LGC in SKOV-3 cells. Cellular uptake of FITC-labeled LG and LGC in SKOV-3 cells monitored by fluorescence microscopy after 12 h of incubation at 37 _C (scale bar: 10 µm). Flow cytometry histogram of cell count versus FITC intensity (FITC-A denotes FITC area) of FITC-labeled LG and LGC added to SKOV-3. Bar graphs represent the median fluorescent intensity of the FITC signal detected in SKOV-3 cells against the concentration of FITC-labeled LG and LGC. Data are representative of three sets of experiments. Data are represented as mean±SD. Asterisks indicate statically different from control untreated cells, **p≤0.01, ***p≤0.001, ****p≤0.0001. Lower panel represented SEM micrograph of SKOV-3 cells showed cellular uptake and internalization of LG, LGC complexes in cytoplasm and around of nuclei. Images showes blebs; cytoplasmic extrusions, membrane holes, and cellular change morphology and lysis.
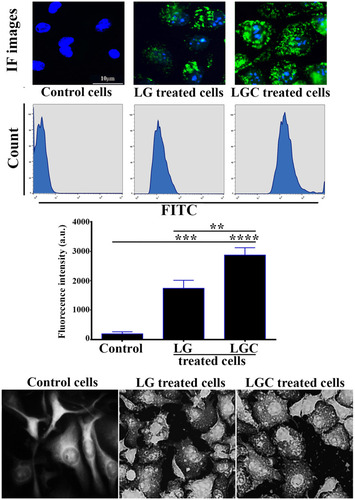
Figure 9 Dysfunction of MMP in SKOV-3 cells. The fluorescent intensity of MMP indicator JC 1 in control and treated cells as indicated. (A) Graph represented the statistical analysis of fluorescent intensity ratio. (B) Flow cytometry data in SKOV-3 cells were treated as indicated Rhodamine stain was used to investigate loss of Mitochondrial Membrane Potential. The data are represented as mean ± SD. Asterisks indicate statically different from control untreated cells, *p≤0.05, ***p≤0.001.
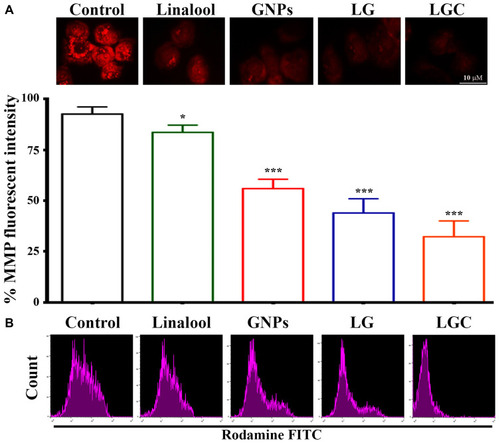
Figure 10 Quantitative analysis of the human apoptosis proteome profiler array in SKOV-3 cells. Cells were treated with LGC for 24 h, then cells were lysed and protein arrays were performed. Equal amounts (250 μg) of protein from each control and treated samples were used for the assay. (A) Representative bar graph of the apoptotic up-regulated proteins. (B) Bar graph shows the apoptotic down-regulated proteins. The results are represented as the mean ± SD.
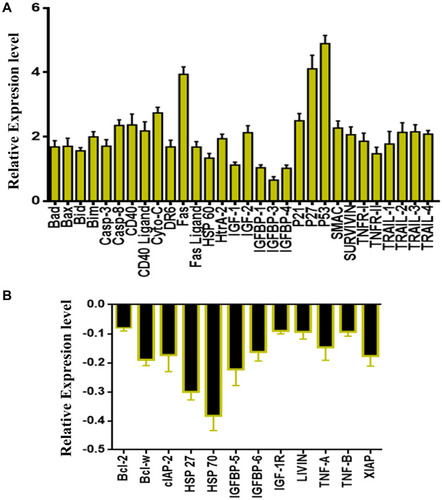
Figure 11 LG and LGC up regulated of caspase-8 and P53 level in SKOV-3 cells. (A) SKOV-3 cells were treated as indicated. Fluorescence histograms of immunolabeled caspase-8 and P53 were assessed by flow cytometry. (B) Bar graph represented the expression of P53 and Caspase-8 levels in SKOV-3 cells after treated as indicated. Results are shown as mean ± SD. Asterisks indicate statically different from control untreated cells, *p≤0.05, **p≤0.01, ***p≤0.001, ****p≤0.0001.
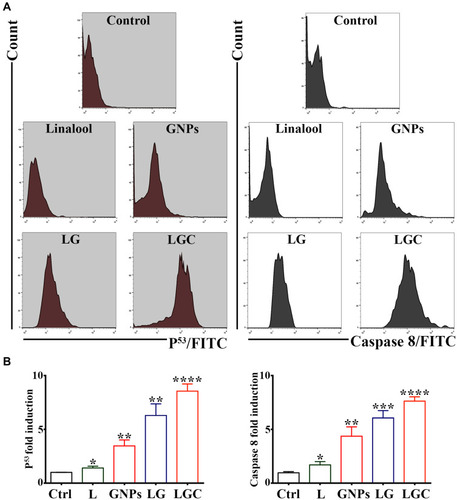
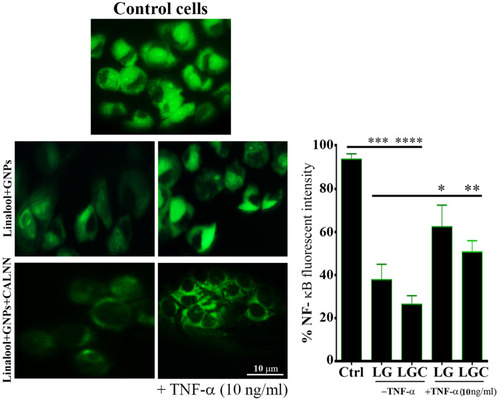
Figure 12 LG and LGC down-regulated of NF-κB activation in SKOV-3 cells. The fluorescence images showed NF-κB activation signaling in cells after treated as indicated in the presence and absence of TNF-α at concentration 10 ngmL-1. Chart represented quantitative analysis of three independent experiments. The results are represented as the mean ± SD. Asterisks indicate statically different from control untreated cells, ***p≤0.001, ****p≤0.0001, and statically different from treated cells as indicated in the presence and absence of TNF-α at concentration 10 ngmL-1, *p≤0.05, **p≤0.01.