Figures & data
Table 1 Several Reaction Conditions Tested for the Biosynthesis of Au@CT
Figure 1 UV-Vis spectra of gold nanoparticles synthesized from C. tamariscifolia (Au@CT) under different reaction conditions (A and B). Time course absorbance measurements of Au@CT synthesized with CT extract at 0.1 g/mL and with 0.4 mM of gold (C).
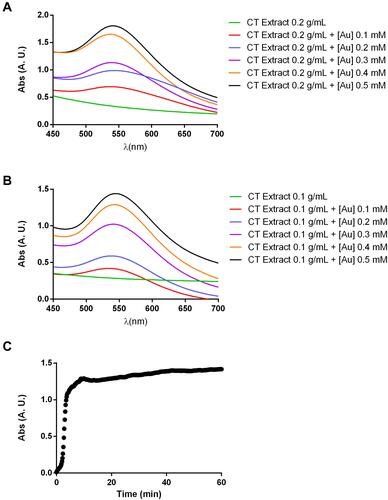
Figure 2 Low magnification TEM images of gold nanoparticles synthesized with (A) 0.2 g/mL and (B) 0.1 g/mL of C. tamariscifolia extract and 0.4 mM of gold, and their corresponding size distribution histogram.
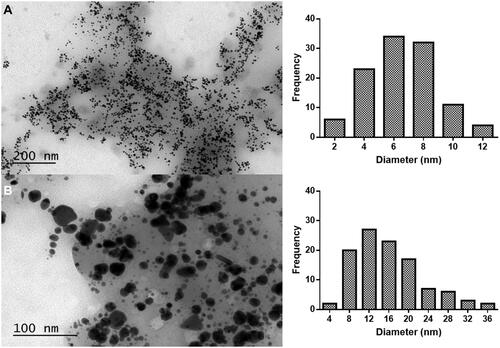
Figure 3 (A) HRTEM image of Au@CT; (B) Fourier capture showing the polycrystalline nature of Au@CT; (C) amplification of the selected area showing interplanar distance of the Au@CT crystalline structure, with the calculated d-spacing and corresponding Miller index.
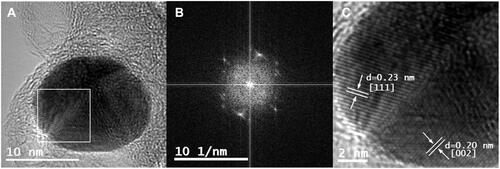
Figure 4 (A) DF-STEM images showing Z-contrast, (B) elemental mapping image, (C) EDX and (D) EELS spectra of Au@CT.
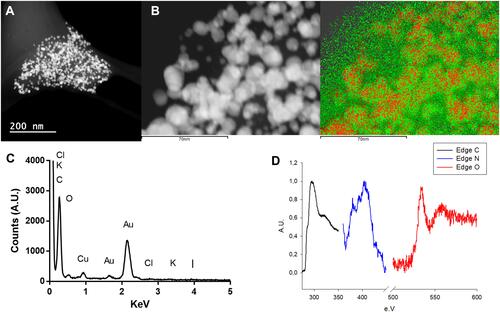
Figure 5 FTIR spectra of CT extract and Au@CT, compared to fucoidan.
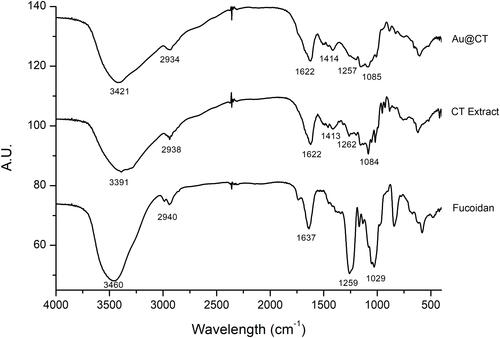
Table 2 In vitro Antioxidant Activity of Algae Extracts and Their AuNPs
Figure 6 MTT data on exposure of CB and CT extracts (A and B, respectively), and the correspondent Au@CB and Au@CT (C and D, respectively) to mammalian (L929, mouse) fibroblast cells, for 24 and 48 h.
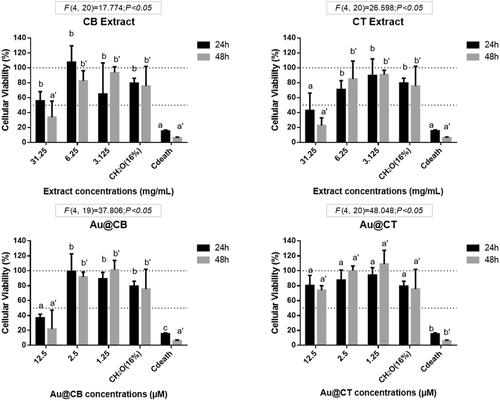
Figure 7 Cumulative survival of zebrafish embryos exposed to CB and CT extracts (A and B, respectively), and the corresponding Au@CB and Au@CT (C and D, respectively), for 80 hpf.
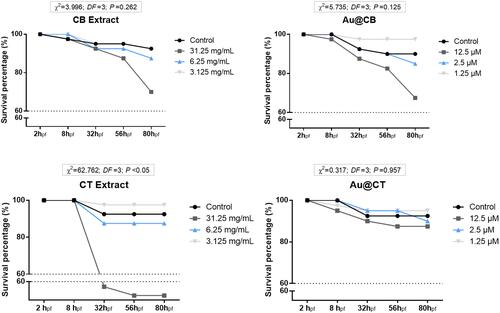
Table 3 Statistical Analysis of Lethal and Sub-Lethal Effects Detected on Zebrafish Embryonic Development Upon Exposure of CB or CT Extracts and Their AuNPs
Figure 8 Yolk sac and pericardial edemas (A and B, respectively) detected on zebrafish embryos exposed to CB and CT extracts, and the corresponding Au@CB and Au@CT, at 32 and 56 hpf, respectively.
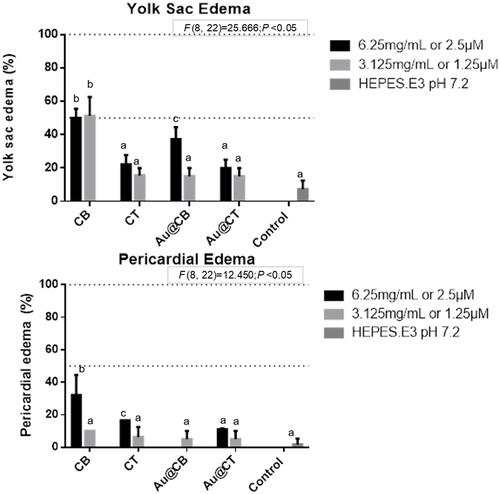
Figure 9 Wound-healing assay data for pre-incubation of CB and CT extracts (A and B, respectively), and the corresponding Au@CB and Au@CT (C and D, respectively), in mammalian (L929, mouse) fibroblast cells.
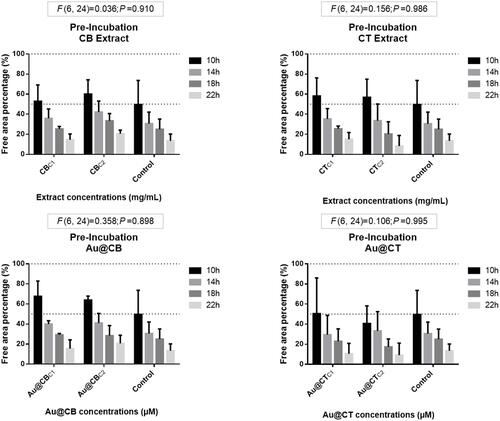
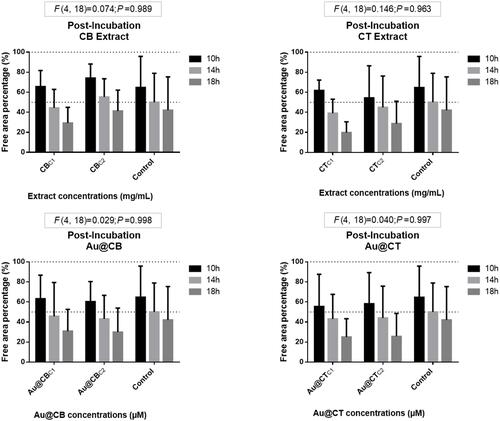
Figure 10 Wound-healing assay data for post-incubation CB and CT extracts (A and B, respectively), and the correspondent Au@CB and Au@CT (C and D, respectively), in mammalian (L929, mouse) fibroblast cells.