
Figures & data
Table 1 Concentration of TGP (% w/v) and Ch (% w/v) for the Preparation of Nanoparticles
Figure 1 Schematic representation of PEC formation between chitosan and tamarind gum polysaccharide.
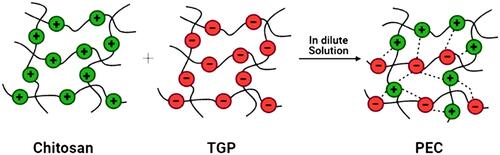
Table 2 IR Interpretation of TGP
Table 3 IR Interpretation of Simvastatin
Table 4 IR Interpretation of Chitosan
Table 5 IR Interpretation of IR Spectra of the Physical Mixture of Ch, TGP and Simvastatin
Figure 2 IR spectra of TGP.
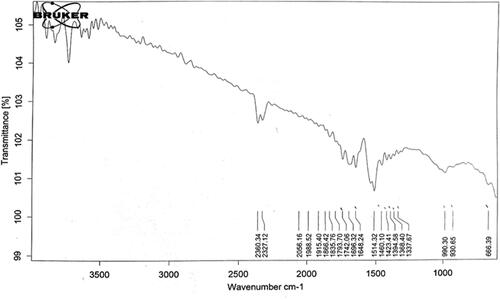
Figure 3 IR spectra of simvastatin.
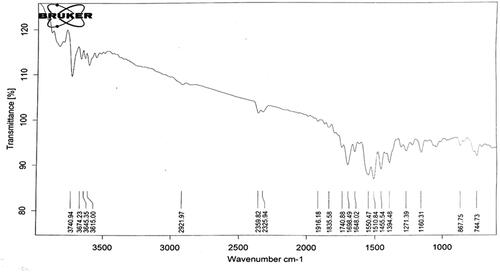
Figure 4 IR spectra of chitosan.
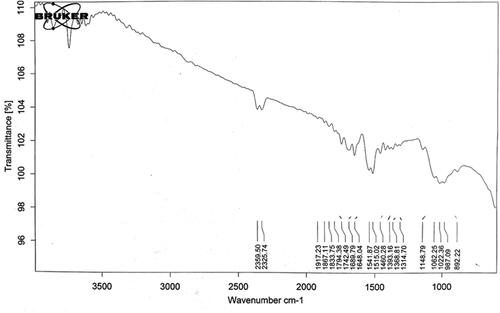
Figure 5 IR spectra of the physical mixture of Ch, TGP and simvastatin.
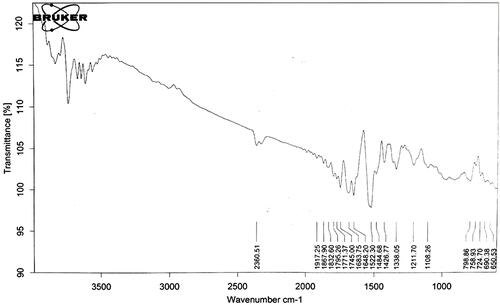
Figure 6 Surface plot for effect of independent variables over size of nanoparticles.
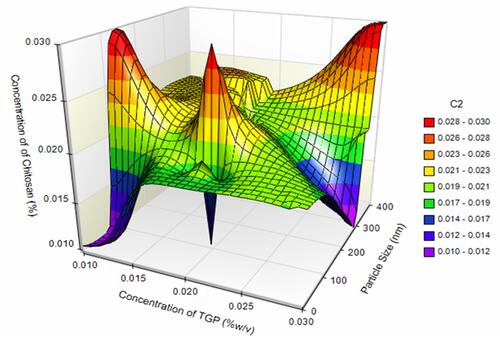
Figure 7 Surface plot for effect of independent variables over entrapment efficiency of nanoparticles.
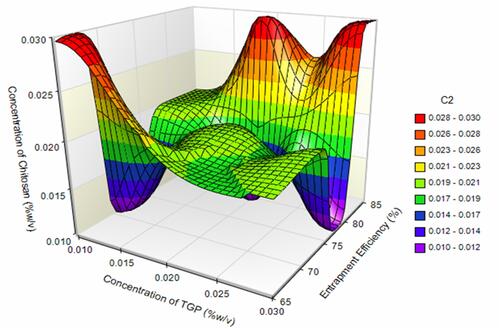
Table 6 Characterization Parameters of PEC Stabilized Nanoparticles
Figure 8 SEM image of (A) Ch, (B) TGP, (C) drug precipitates and (D) nanoparticles-T5.
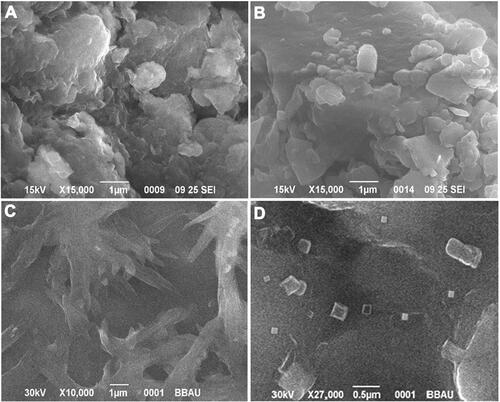
Figure 9 DR (%) of formulations via egg membrane (A) T1, T2, T3; (B) T4, T5, T6; and (C) T7, T8, T9.
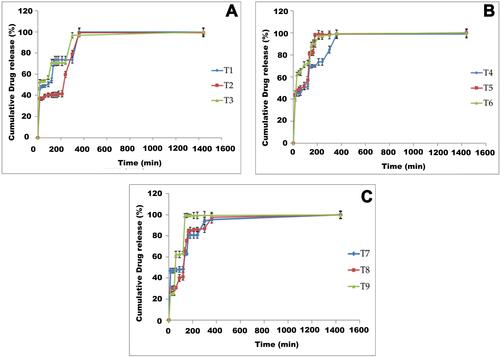
Figure 10 DR (%) of formulations via tomato membrane (A) T1, T2, T3; (B) T4, T5, T6; and (C) T7, T8, T9.
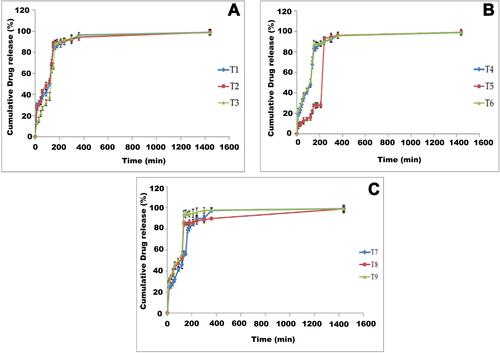
Table 7 T50% and T80% of Prepared Nanoformulations
Table 8 Drug Release Data of PEC-based Nanoparticles Through Egg Membrane
Table 9 Drug Release Data of PEC Based Nanoparticles Through Tomato Membrane
Table 10 Particle Growth Analysis and Zeta Potential After 7th Day, 14th Day and 21st Day
Table 11 Stability Study Parameters of Nanoformulations
Table 12 List of Chitosan-based PEC Nanoparticles and Their Outcomes
Figure 11 Anticancerous activity of nanoparticles (T5) and pure drug precipitates.
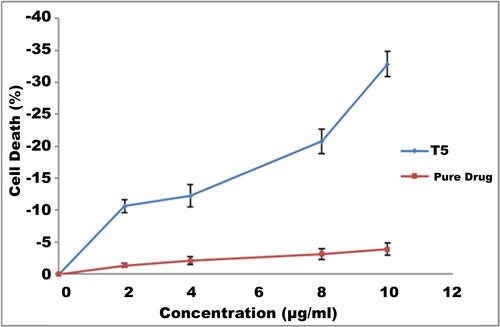
Figure 12 Bright field image of (A) untreated MCF-7 cells, (B) MCF-7 cells treated with nanoparticles (T5) and (C) MCF-7 cells treated with pure simvastatin.
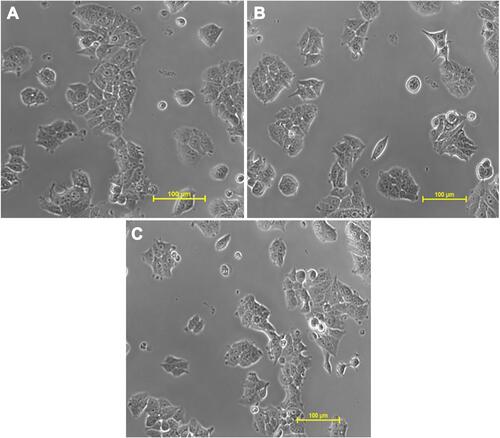
Table 13 Cell Death (%) After Administration of Pure Drug and Nanoparticles at Different Concentrations