Figures & data
Table 1 Physical Characterization of La2O3 Nanoparticles Using Dynamic Light Scattering. Data Represent the Mean ± Standard Error (± S.E) of Three Independent Experiments
Figure 1 (A) SEM image of La2O3NPs (B). TEM image of La2O3NPs (C). Distribution of La2O3NPs in water suspension (D). XRD spectrum of La2O3NPs.
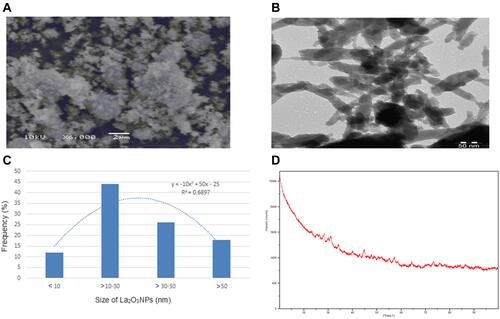
Figure 2 TEM micrographs of La2O3 NPs cellular uptake (A). CHANG control (B). CHANG at 100 μg/mL La2O3 NPs for 24 hrs (C). HUH-7 control (D). HUH-7 at 100 μg/mL La2O3 NPs for 24 hrs. Black arrow = small NP aggregates.
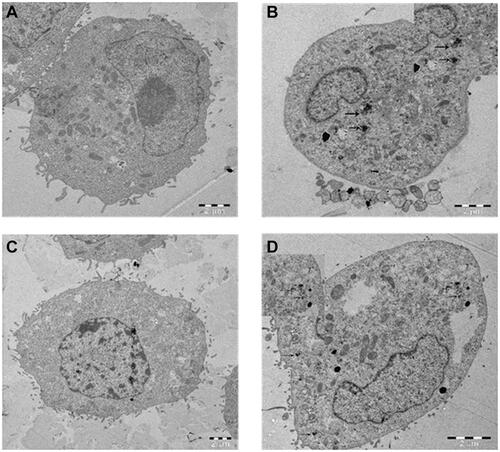
Figure 3 Cytotoxicity of La2O3NPs on CHANG and HuH-7 cells for 24 hrs, as evaluated by (A). MTT (B). LDH assays. Each value represents the mean ±SE of three experiments. n= 3, *p < 0.05 vs control.
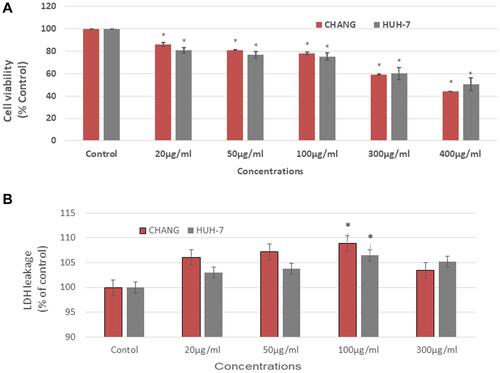
Figure 4 After exposure of La2O3NPs, production of intracellular ROS in CHANG and HuH-7 for 24 hrs (A). Percent of DCF fluorescence intensity and generation of green fluorescence in CHANG and HuH-7 for 24 hrs after exposure of La2O3NPs (B). Control CHANG cells (C). CHANG cells at 20 μg/mL (D). CHANG cells at 50 μg/mL (E). CHANG cells at 100 μg/mL (F). CHANG cells at 300 μg/mL (G). Control HuH-7 cells (H). HuH-7cells at 20 μg/mL (I). HuH-7cells at 50 μg/mL (J). HuH-7cells at 100 μg/mL (K). HuH-7cells at 300 μg/mL. Each value represents the mean ±SE of three experiments. *p < 0.05 vs control.
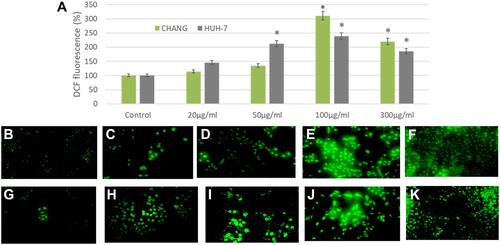
Figure 5 After exposure of La2O3NPs on CHANG and HuH-7 for 24 hrs (A). Levels of GSH (B). SOD in cells. Each value represents the mean ±SE of three experiments. *p < 0.05 vs control.
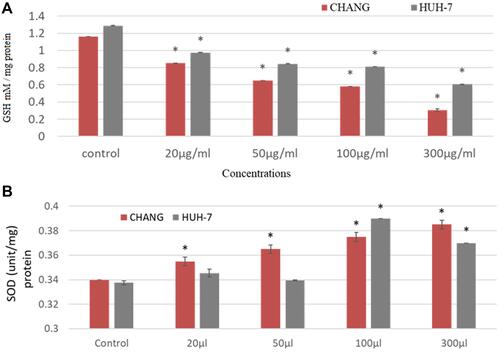
Figure 6 After exposure of La2O3NPs, scatter diagram of apoptotic and necrotic CHANG and HuH-7 for 24 hrs (A). Control CHANG cells (B). CHANG cells at 20 μg/mL (C). CHANG cells at 50 μg/mL (D). CHANG cells at 100 μg/mL (E). CHANG cells at 300 μg/mL (F). Control HuH-7 cells (G). HuH-7cells at 20 μg/mL (H). HuH-7cells at 50 μg/mL (I). HuH-7cells at 100 μg/mL (J). HuH-7cells at 300 μg/mL. (K) Percent of apoptotic and necrotic CHANG and HuH-7 for 24 hrs after exposure of La2O3NPs. Each value represents the mean ±SE of three experiments. *p < 0.05 vs control.
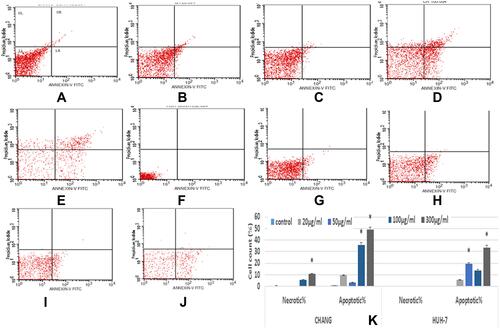
Figure 7 After exposure of La2O3NPs, induction of apoptotic and necrotic cells in CHANG and HuH-7 for 24 hrs (A). AO/Etbr staining fluorescence in CHANG cells for 24 hrs after exposure of La2O3NPs (B). AO/Etbr staining fluorescence HuH-7 cells for 24 hrs after exposure of La2O3NPs (C). Percent of apoptotic cells in CHANG and HuH-7cells after exposure of La2O3NPs for 24 hrs. Each value represents the mean ±SE of three experiments. *p < 0.05 vs control cells. Arrow indicates apoptotic cells.
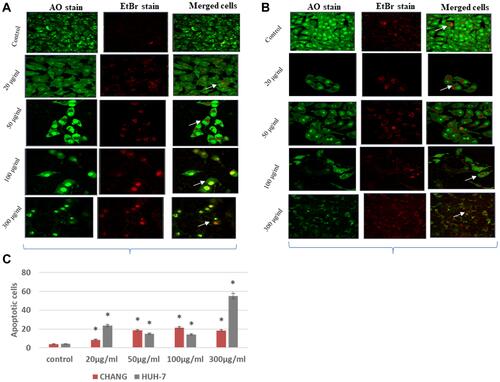
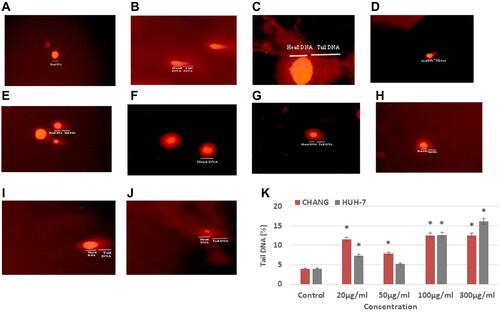
Figure 8 After exposure of La2O3NPs, DNA damage in CHANG and HuH-7 for 24 hrs (A). Control CHANG cells (B). CHANG cells at 20 μg/mL (C). CHANG cells at 50 μg/mL (D). CHANG cells at 100 μg/mL (E). CHANG cells at 300 μg/mL (F). Control HuH-7 cells (G). HuH-7cells at 20 μg/mL (H). HuH-7cells at 50 μg/mL (I). HuH-7cells at 100 μg/mL (J). HuH-7cells at 300 μg/mL. (K) Percent of tail DNA damage in CHANG and HuH-7 for 24 hrs after exposure of La2O3NPs. Each value represents the mean ±SE of three experiments. *p < 0.05 vs control.