Figures & data
Table 1 Primer Sequences of Genes Analyzed in Real Time-PCR
Figure 1 Characterization of lycopene-coated selenium nanoparticles (LYC-SeNPs). (A) Color of LYC-SeNPs at 24 h. (B) Hydrodynamic diameter of LYC-SeNPs by Zetasizer. (C) Surface charge of LYC-SeNPs by Zeta potential. (D) XRD spectra of LYC-SeNPs. (E) Morphological shape of LYC-SeNPs as observed by TEM. (F) FT-IR spectra of LYC-SeNPs.
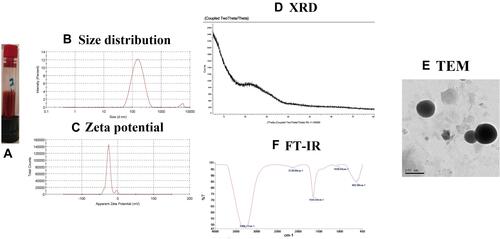
Figure 2 The effect of lycopene coated selenium nanoparticles (LYC-SeNPs) on the rhabdomyolysis related parameters in glycerol-induced AKI model in rats. Data are expressed as mean ± SEM, n = 7. The statistical difference between groups was estimated using Duncan’s post-hoc test at P < 0.05. Bars that do not share same letters (superscripts) are significantly different from each other (p < 0.05).
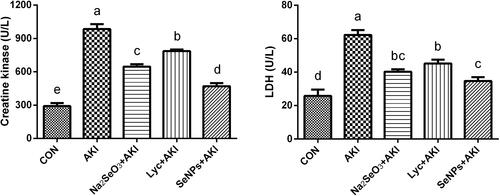
Figure 3 The effect of lycopene coated selenium nanoparticles (LYC-SeNPs) on kidney weight and renal function markers in glycerol-induced acute kidney injury. Data are expressed as mean ± SEM, n = 7. The statistical difference between groups was estimated using Duncan’s post-hoc test at P < 0.05. Bars that do not share same letters (superscripts) are significantly different from each other (p < 0.05).
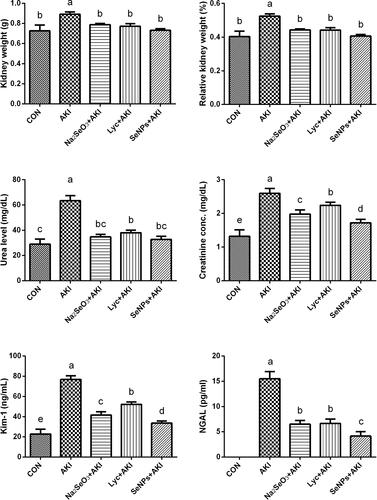
Figure 4 The effect of lycopene coated selenium nanoparticles (LYC-SeNPs) on non-enzymatic antioxidant parameters [malondialdehyde (MDA), nitric oxide (NO), and glutathione (GSH)] levels in glycerol-induced AKI in rats. Data are expressed as mean ± SEM, n = 7. The statistical difference between groups was estimated using Duncan’s post-hoc test at P < 0.05. Bars that do not share same letters (superscripts) are significantly different from each other (p < 0.05).
![Figure 4 The effect of lycopene coated selenium nanoparticles (LYC-SeNPs) on non-enzymatic antioxidant parameters [malondialdehyde (MDA), nitric oxide (NO), and glutathione (GSH)] levels in glycerol-induced AKI in rats. Data are expressed as mean ± SEM, n = 7. The statistical difference between groups was estimated using Duncan’s post-hoc test at P < 0.05. Bars that do not share same letters (superscripts) are significantly different from each other (p < 0.05).](/cms/asset/713b9e53-6d98-476b-ade8-a84ecb0d6aa3/dijn_a_12192363_f0004_b.jpg)
Figure 5 The effect of lycopene coated selenium nanoparticles (LYC-SeNPs) on antioxidant enzymatic activities in glycerol-induced acute kidney injury. Data are expressed as mean ± SEM, n = 7. The statistical difference between the control and glycerol injected groups was estimated using Duncan’s post-hoc test at P < 0.05. Bars that do not share same letters (superscripts) are significantly different from each other (p < 0.05).
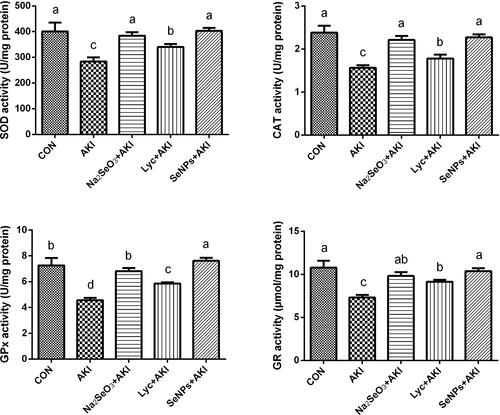
Figure 6 The effect of lycopene coated selenium nanoparticles (LYC-SeNPs) on mRNA expression of Nfe212 and Hmox-1 in glycerol-induced AKI in rats. Data are expressed as mean ± SEM, n = 7. The obtained results were demonstrated as the mean ± SEM of triplicate experiments and were referenced to Gapdh and represented as a fold change (log2 scale), with respect to mRNA levels in the control group. The statistical difference between groups was estimated using Duncan’s post-hoc test at P < 0.05. Bars that do not share same letters (superscripts) are significantly different from each other (p < 0.05).
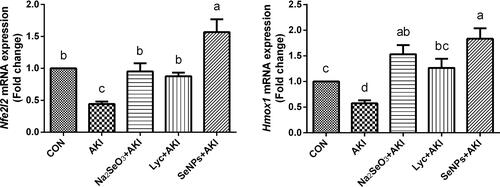
Figure 7 The effect of lycopene coated selenium nanoparticles (LYC-SeNPs) on the levels of inflammatory biomarkers (TNF-α, IL-1β and IL-6) and Nos2 mRNA expression in glycerol-induced AKI in rats. For ELISA results, data are expressed as mean ± SEM, n = 7. The statistical difference between the control and glycerol injected groups was estimated using Duncan’s post-hoc test at P < 0.05. Bars that do not share same letters (superscripts) are significantly different from each other (p < 0.05). For qRT-PCR findings, the obtained results were demonstrated as the mean ± SEM of triplicate experiments and were referenced to Gapdh and represented as a fold change (log2 scale), with respect to mRNA levels in the control group.
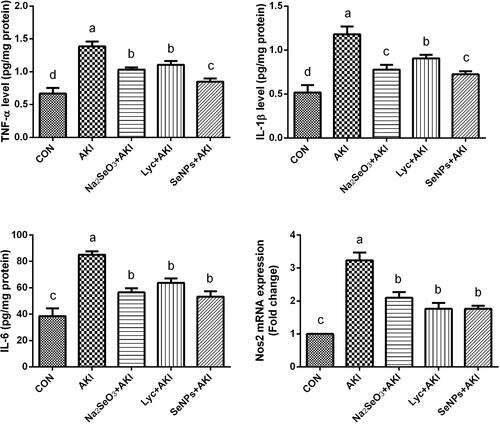
Figure 8 The effect of lycopene coated selenium nanoparticles (LYC-SeNPs) on the levels of apoptotic and necroptotic related markers in glycerol-induced AKI in rats. For ELISA results, data are expressed as mean ± SEM, n = 7. The statistical difference between groups was estimated using Duncan’s post-hoc test at P < 0.05. Bars that do not share same letters (superscripts) are significantly different from each other (p < 0.05). For qRT-PCR findings, the obtained results were demonstrated as the mean ± SEM of triplicate experiments and were referenced to Gapdh and represented as a fold change (log2 scale), with respect to mRNA levels in the control group.
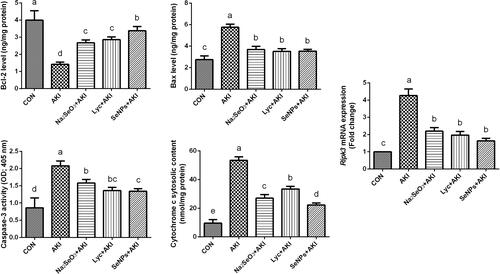
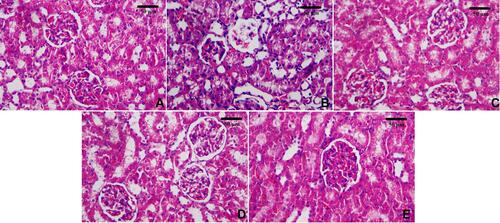
Figure 9 Histopathological alterations in the renal tissue following glycerol injection and different treatments. (A) Control, (B) AKI, (C) Na2SeO3+AKI, (D) LYC+AKI, and (E) LYC-SeNPs+AKI. Hematoxylin and eosin (H&E), scale bar= 50 μm.