
Figures & data
Table 1 Hydrated Diameter (nm) and Zeta Potential (mv) of Ag-NPs and Zn-NPs
Figure 1 TEM image of Ag-NPs.
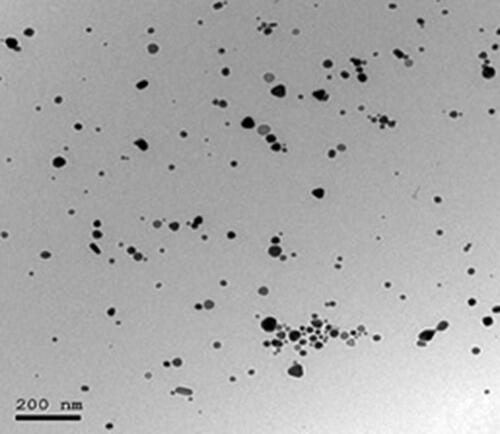
Figure 2 TEM image of Zn-NPs.
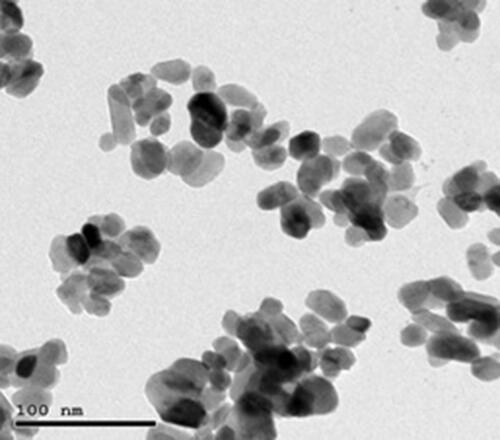
Table 2 Effects of Exposure to Ag-NPs and/or Zn-NPs on Sperm Motility (%), Concentration (× 106/Epididymis), and Live Sperms (%)
Table 3 Effects of Exposure to Ag-NPs and/or Zn-NPs on Sperm Morphological Abnormalities (%)
Figure 3 Sperms of rats exposed to Ag-NPs showing an increased incidence of head and tail deformities and decreased viability: live sperm (yellow arrow), dead sperm (red arrow), coiled tail (white arrow), curved tail (black arrow) and detached head (blue arrow).
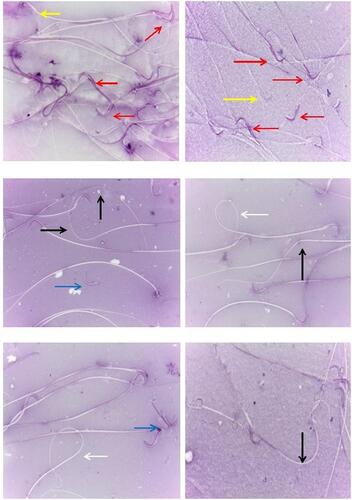
Figure 4 (A, B) sperms of control rats showing normal morphology; (C) sperms of rats exposed to Zn-NPs showing normal morphology; (D–F) sperms of rats exposed to Ag-NPs and Zn-NPs showing a decreased incidence of head and tail deformities and increased viability compared to Ag-NPs group: live sperm (yellow arrow), dead sperm (red arrow), coiled tail (white arrow), curved tail (black arrow) and detached head (blue arrow).
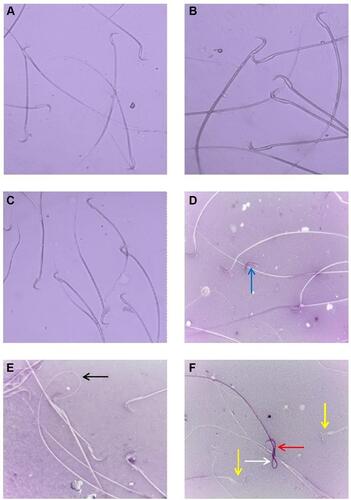
Figure 5 Effects of exposure to Ag-NPs and/or Zn-NPs on (A) GSH, (B) CAT, and (C) MDA levels in testicular tissue. Values are presented as mean ± SD (n = 10 rats/group). (a) indicates presence of a statistically significant difference from the control group and (b) indicates presence of a statistically significant difference from Ag-NPs group at p< 0.05.
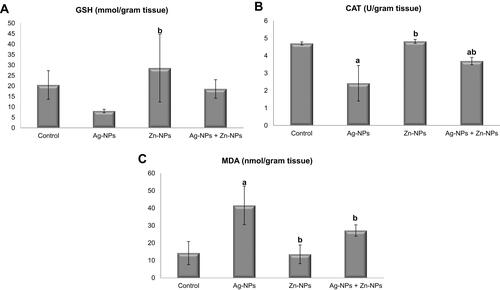
Figure 6 Effects of exposure to Ag-NPs and/or Zn-NPs on (A) testosterone, (B) FSH, and (C) LH levels in serum. Values are presented as mean ± SD (n = 10 rats/group). (a) indicates presence of a statistically significant difference from the control group and (b) indicates presence of a statistically significant difference from Ag-NPs group at p< 0.05.
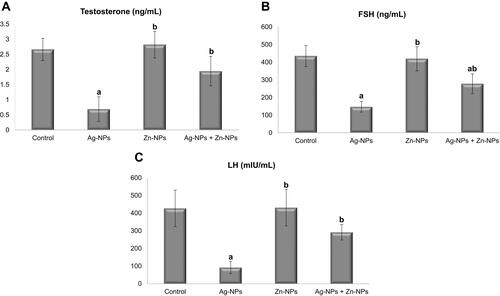
Table 4 Effects of Exposure to Ag-NPs and/or Zn-NPs on Comet Assay Parameters on Testicular Tissue
Figure 7 Comet assay in testicular tissue of rats showing the effects of exposure to Ag-NPs and/or Zn-NPs on DNA damage: (A) control group; (B) Ag-NPs group; (C) Zn-NPs group; (D) Ag-NPs + Zn-NPs group. Yellow arrow indicates a nucleus without tail (intact DNA). Blue arrow indicates a nucleus with tail (DNA break).
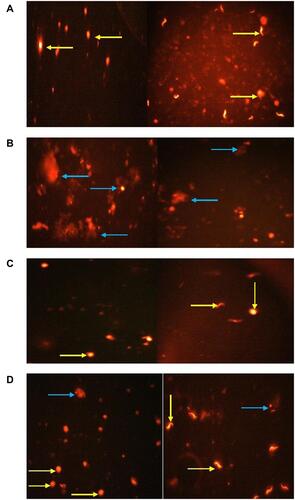
Figure 8 H&E-stained testicular sections. Effect of exposure to Ag-NPs and/or Zn-NPs on the microscopic appearance of testicular tissue. (A) Testis of control rat showing normal seminiferous tubules with densely packed spermatogonial cells’ layers, spermatogenesis and normal sperms in the lumen (arrow). (B) Testis of Zn-NPs administered rat showing normal seminiferous tubules with active spermatogenesis. (C–G) testis of Ag-NPs administrated rat showing; (C) Thickening of the testicular capsule (arrow) and congested capsular blood vessels with thickening and edema (dotted arrow) of their walls, (D) Disorganized spermatogonial cells’ layers and detached germinal epithelium (dotted arrow) from the basement membrane of the seminiferous tubules and mild interstitial edema (arrow), (E) Degeneration, necrosis and nuclear pyknosis of the spermatogonial cells, (F) Defective spermatogenesis and presence of multinucleated spermatid giant cells (arrow), (G) Seminiferous tubules appeared with irregular contour (arrow) of seminiferous tubules with marked wide spaces between them. (H and I) Testis of Ag-NPs and Zn-NPs co-administered rat showing near to normal appearance of seminiferous tubules with active spermatogenesis, active sperms (dotted arrow) in the lumen of seminiferous tubules and spermatogonial cells (arrow).
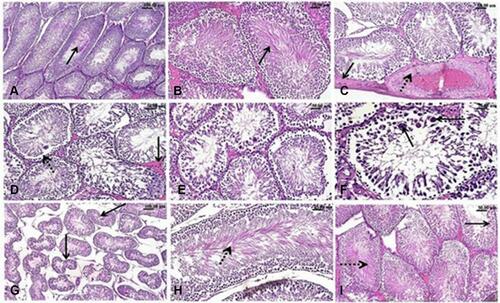
Table 5 Effects of Exposure to Ag-NPs and/or Zn-NPs on Morphometric Parameters of Seminiferous Tubules Including Area, Circumference, and Mean Diameter