Figures & data
Table 1 Characteristics of the PEI–TEG and man-PEI–TEG derivates: feed ratio, weight-average molecular weight (Mw), polydispersity index (PDI), and mannose content
Figure 1 Synthetic route of mannosylated biodegradable PEI derivates. (A) mannopyranosylphenyl isothiocyanate; (B) PEI–TEG and man-PEI–TEG.
Abbreviations: Ac2O, acetic anhydride; C5H5N, pyridine; BF3Et2O, boron fluoride ethyl ether; Pd-C, palladium-carbon; TEA, triethylamine; Boc2O, di-tert-butyl dicarbonate; PEI, polyethyleneimine; TEG, triethyleneglycol; PEI-TEG, polyethyleneimine and triethyleneglycol polymer; man-PEI-TEG, mannosylated PEI-TEG; NPC, 4-nitrophenyl chloroformate; PEI600, polyethyleneimine with a molecular weight of 0.6 kD; PEI2000, polyethyleneimine with a molecular weight of 2 kD; RT, room temperature.
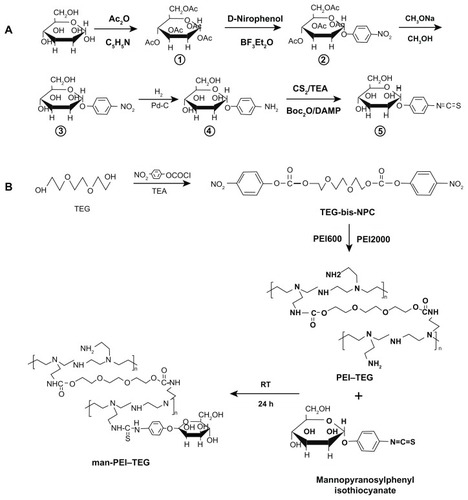
Figure 2 1H-NMR spectrum of mannopyranosylphenyl isothiocyanate in CD3OD: δ = 7.1–7.2 (4Ar-H), δ = 5.5 (C1-H), δ = 3.2–4.0 (C2-H,C3-H,C4-H,C5-H.2C6-H); 1H-NMR spectrum of PEI–TEG in D2O: δ = 4.23 (NHCOOCH2CH2OCH2), δ = 3.77 (NHCOOCH2CH2OCH2), δ = 3.73 (NHCOOCH2CH2OCH2), δ = 3.48; 1H-NMR spectrum of PEI–TEG-A in D2O: δ = 4.23 (NHCOOCH2CH2OCH2), δ = 3.77 (NHCOOCH2CH2OCH2), δ = 3.73 (NHCOOCH2CH2OCH2), δ = 3.48 (HOCH2CH2OCH2), δ = 3.3–2.5 (–NHCH2CH2–), δ = 7.0–7.4 (–CH–, mannopyranosylphenyl isothiocyanate).
Abbreviations: PEI, polyethyleneimine; TEG, triethyleneglycol; PEI-TEG, polyethyleneimine and triethyleneglycol polymer; PEI-TEG-A, mannosylated PEI-TEG derivative A; ppm, parts per million.
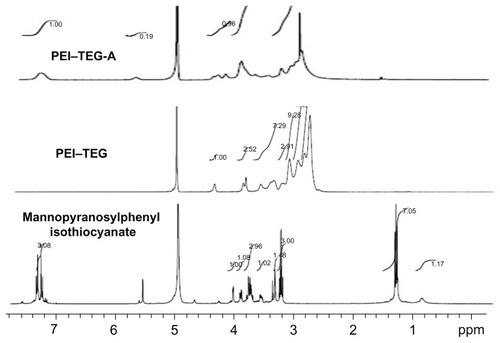
Figure 3 Characterization of PEI/DNA complex (n = 3). (A) Average particle size, (B) Zeta-potential.
Note: The PEI/DNA complexes were prepared at an N/P ratio ranging from 5:1 to 40:1, determined using photon correlation spectroscopy.
Abbreviations: PEI, polyethyleneimine; TEG, triethyleneglycol; PEI-TEG, polyethyleneimine and triethyleneglycol polymer; A, mannosylated PEI-TEG derivative A; B, mannosylated PEI-TEG derivative B; C, mannosylated PEI-TEG derivative C; PEI25k, polyethyleneimine with a molecular weight of 25 kD.
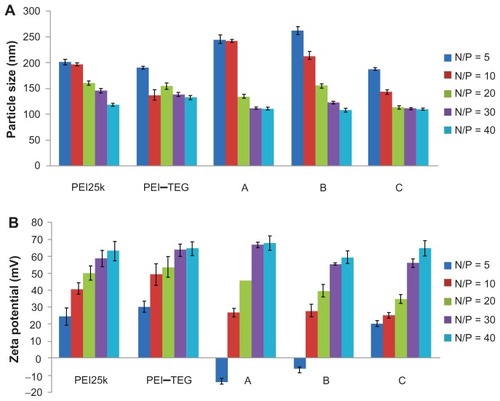
Figure 4 DNA retardation and DNase I protection assay. (A) DNA-binding abilities of all PEI derivates were examined by agarose gel electrophoresis, and the examining mass ratios of PEI:DNA were 2:1 and 3:1 respectively. (B) PEI/DNA complexes were prepared at a ratio of 3:1 (w/w) and tested for their abilities to protecting DNA against the DNase I degradation.
Notes: +, samples treated with DNase I; –, samples treated with PBS.
Abbreviations: PEI, polyethyleneimine; TEG, triethyleneglycol; PEI-TEG, polyethyleneimine and triethyleneglycol polymer; A, mannosylated PEI-TEG derivative A; B, mannosylated PEI-TEG derivative B; C, mannosylated PEI-TEG derivative C; PEI25k, polyethyleneimine with a molecular weight of 25 kD.
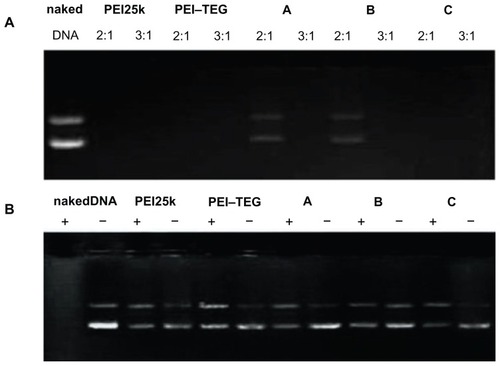
Figure 5 Cytotoxicity tests of the PEI/DNA complexes on the DC2.4 cell line.
Notes: The viability of cells treated with PEI/DNA complexes at various N/P ratios was measured by the MTT assay, and cells treated with culture media only were taken to be 100% viable. The data were represented as mean ± standard deviation (SD) of three independent experiments (n = 3).
Abbreviations: PEI, polyethyleneimine; TEG, triethyleneglycol; PEI-TEG, polyethyleneimine and triethyleneglycol polymer; A, mannosylated PEI-TEG derivative A; B, mannosylated PEI-TEG derivative B; C, mannosylated PEI-TEG derivative C; PEI25k, polyethyleneimine with a molecular weight of 25 kD; DC, dendritic cells; MTT, 3-(4,5-dimethylthiazol-2-yl)-2, 5-diphenyltetrazolium bromide; SD, standard deviation.
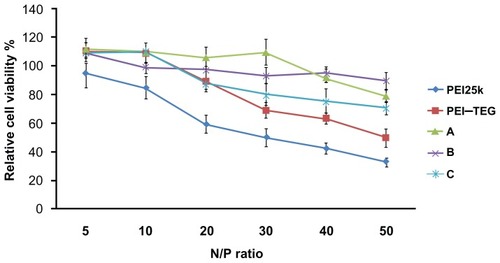
Figure 6 The transfection efficiency of PEI derivates/DNA complexes on the DC2.4 cell line in the absence of serum. The N/P ratios of complexes were optimized by a preliminary experiment, and the optimal N/P ratio of complex of PEI25k, PEI–TEG, and man-PEI–TEG conjugates A, B, and C were 10, 30, 50, 40, and 30, respectively. The data were represented as mean ± standard deviation (SD) of three independent experiments (n = 3).
Notes: ▪P < 0.03 vs the group of PEI25k at its optimal N/P ratio; ★P < 0.001 vs the group of PEI25k and PEI–TEG at their optimal N/P ratio; ▴P < 0.03 vs the group of man-PEI–TEG conjugates A and C at their optimal N/P ratio.
Abbreviations: PEI, polyethyleneimine; TEG, triethyleneglycol; PEI-TEG, polyethyleneimine and triethyleneglycol polymer; A, mannosylated PEI-TEG derivative A; B, mannosylated PEI-TEG derivative B; C, mannosylated PEI-TEG derivative C; PEI25k, polyethyleneimine with a molecular weight of 25 kD; DC, dendritic cells; RLU, relative light unit; SD, standard deviation.
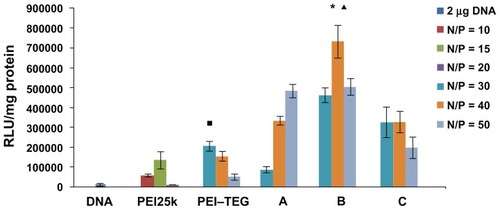
Figure 7 Confocal micrographs of cellular uptake of complexes on the DC2.4 cell line.
Notes: Cells were incubated with complexes prepared from PEI25k, PEI–TEG, and man-PEI–TEG-B, respectively, at 37°C/4°C for 1 hour prior to fixation with 4% paraformaldehyde (5 minutes, RT) and staining with 2 μg/mL diamidino phenyl indole (DAPI). Green fluorescence, FITC; blue fluorescence, DAPI.
Abbreviations: PEI, polyethyleneimine; TEG, triethyleneglycol; PEI-TEG, polyethyleneimine and triethyleneglycol polymer; man-PEI-TEG-B, mannosylated PEI-TEG derivative B; PEI25k, polyethyleneimine with a molecular weight of 25 kD; DC, dendritic cells; RT, room temperature; DAPI, diamidino phenyl indole; FITC, fluorescein Isothiocyanate.
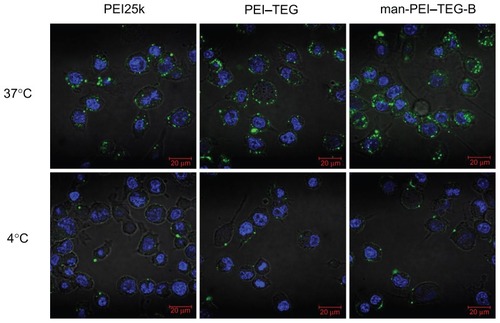
Figure 8 Competition assay with mannan. Prior to the incubation with FITC labeled complexes, cells were pre-incubated with 0.125 mg/mg mannan for 20 minutes or as control with free medium. (A) A representative set of flow cytometry histograms. (B) The mean fluorescence intensity (MFI) of each group of cells.
Notes: ★P < 0.01, vs its control group; ▴P > 0.05, vs its control group.
Abbreviations: PEI, polyethyleneimine; TEG, triethyleneglycol; PEI-TEG, polyethyleneimine and triethyleneglycol polymer; man-PEI-TEG, mannosylated PEI-TEG; PEI25k, polyethyleneimine with a molecular weight of 25 kD.
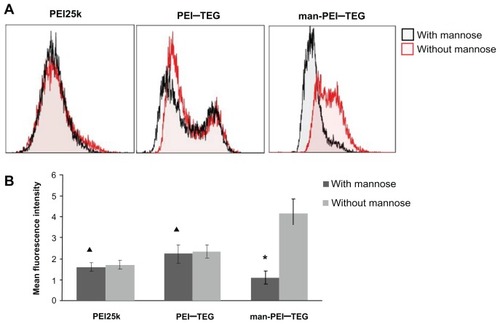
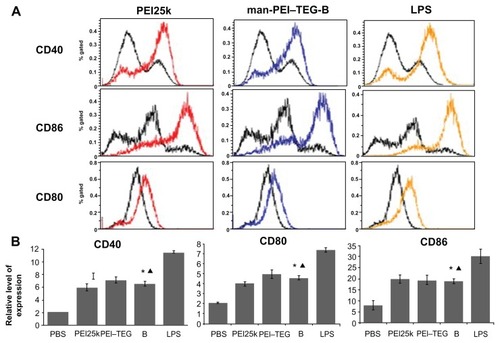
Figure 9 Expression of maturation surface markers (CD40, CD80, and CD86) in BMDCs treated with PEI/DNA complexes. PEI/DNA complexes were prepared at their optimal N/P ratio, and cells treated with PBS and LPS were used as the negative and positive controls, respectively. (A) A representative set of flow cytometry histograms. Black line: cells treated with PBS. (B) Normalized expression level of maturation markers. The data were represented as mean ± standard deviation (SD) of three independent experiments (n = 3).
Notes: ★P < 0.01, vs the group of PBS and LPS; ▴P > 0.05, vs the group of PEI25k and PEI–TEG.
Abbreviations: PEI, polyethyleneimine; TEG, triethyleneglycol; PEI-TEG, polyethyleneimine and triethyleneglycol polymer; man-PEI-TEG-B, mannosylated PEI-TEG derivative B; PEI25k, polyethyleneimine with a molecular weight of 25 kD; DC, dendritic cells; BMDC, Murine bone marrow-derived DCs; LPS, lipopolysaccharide; SD, standard deviation.