Figures & data
Figure 1 Chemical structure of nimodipine.
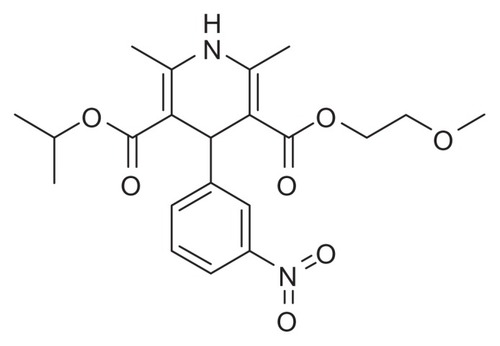
Figure 2 Influence of the mass concentration ratio of EPC and SGC on NIM solubilizing efficiency at 25°C (n = 3).
Abbreviations: EPC, egg phosphatidylcholine; SGC, sodium glycocholate; NIM, nimodipine.
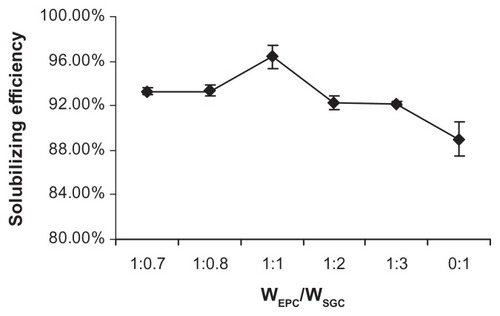
Figure 3 Influence of the total concentration of SGC and EPC on NIM solubilizing efficiency at 25°C (n = 3).
Abbreviations: EPC, egg phosphatidylcholine; SGC, sodium glycocholate; NIM, nimodipine.
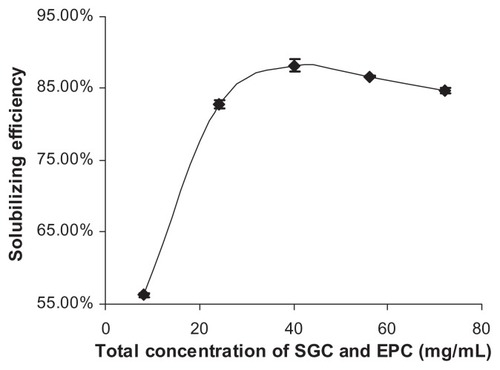
Table 1 Influence of NIM concentration on the stability of NIMEPC- SGC-MMs
Figure 4 Influence of pH value of dispersed medium on NIM solubilizing efficiency at 25°C (n = 3).
Abbreviation: NIM, nimodipine.
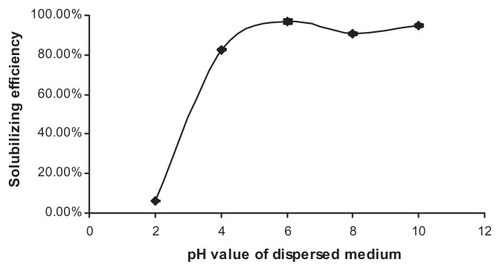
Figure 5 Plot of the fluorescence of pyrene I1/I3 intensity ratio versus concentration of EPC/SGC mixed micelles (mass ratio 1:1) in distilled water at 25°C (n = 3).
Abbreviations: EPC, egg phosphatidylcholine; SGC, sodium glycocholate; I1/I3, intensity of the third to the first peak (372 and 383 nm) of pyrene.
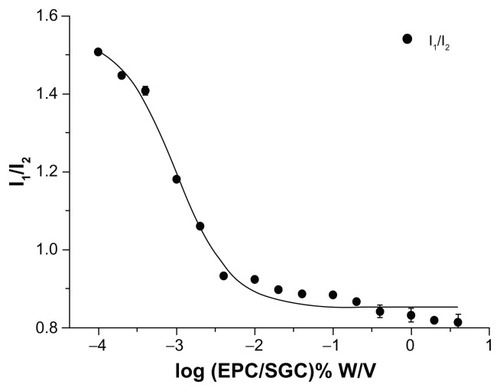
Table 2 Solubility of NIM-EPC-SGC-MMs
Figure 6 (A) Size and size distribution of the optimal NIM-EPC-SGC-MMs; (B) transmission electron micrograph of NIM-EPC-SGC-MMs (scale bar = 50 nm).
Abbreviation: NIM-EPC-SGC-MMs, nimodipine-egg phosphatidylcholine-sodium glycocholate-mixed micelles.
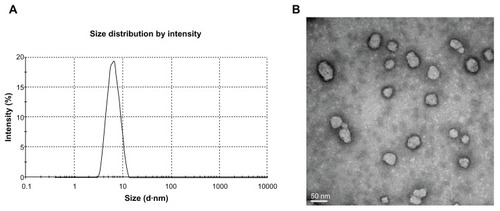
Table 3 The main pharmacokinetic parameters of the NIM injection and NIM-EPC-SGC-MMs in rats
Figure 7 Mean plasma concentration–time curves of NIM after intravenous injection of NIM injection and NIM-EPC-SGC-MMs in rats (n = 5).
Note: Each point represents mean ± standard deviation.
Abbreviations: NIM, nimodipine; NIM-EPC-SGC-MMs, nimodipine-egg phosphatidylcholine-sodium glycocholate-mixed micelles.
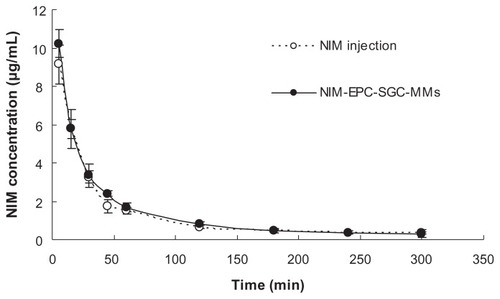
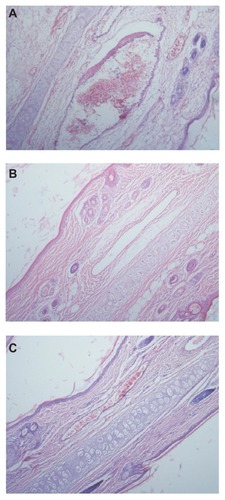
Figure 8 Pathological paraffin sections (hematoxylin-eosin stain) from the ears of rabbits (×100 magnification). (A) Ear sample from rabbit given the NIM injection, showing vasodilation, hemorrhage, and degeneration around and of the vein wall as well as edema around the vein, inflammatory cell infiltration around the vein, and endothelial cell swelling. (B) Ear sample from rabbit given NIM-EPC-SGC-MMs. (C) Ear sample from rabbit given sodium chloride injection. The phenomenon shown in (A) was not observed in (B) or (C).
Abbreviations: NIM, nimodipine; NIM-EPC-SGC-MMs, nimodipine-egg phosphatidylcholine-sodium glycocholate-mixed micelles.