Figures & data
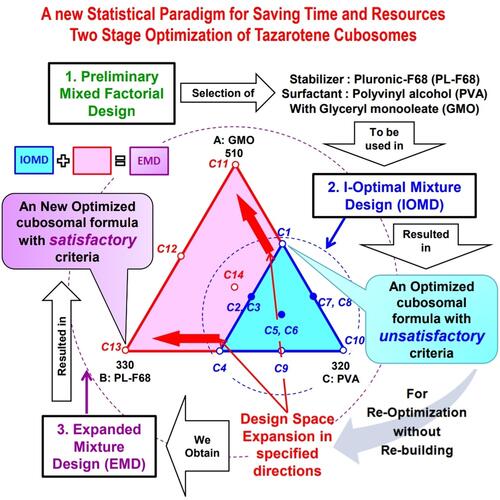
Table 1 Mixture Components Studied in the I-Optimal Mixture Design with Their Constraints Expressed in Different Values
Table 2 Composition and Characterization of Cubosomes Prepared According to Different Design Points of I-Optimal Mixture Design (C1-C10) and Extra Points Added in Expanded Design Space (C11–C14)
Figure 1 I-optimal mixture design (IOMD) space - defined by the constraints 300≤A≤420, 120≤B≤240 and 200≤C≤320 - and its DPs (C1–C11) together with extra added DPs (C11–C14) to give the expanded mixture design (EMD) space defined by the constraints 300≤A≤510, 120≤B≤330 and 110≤C≤320. Where; A = Glyceryl monooleate amount (mg), B = Pluronic F68 amount (mg), and C = Polyvinyl alcohol amount (mg). Design points (DPs): O single trial, ● replicated trial, ◊ selected optimized formulation from IOMD (IOMD-OF), Δ selected optimized formulation from EMD (EMD-OF).
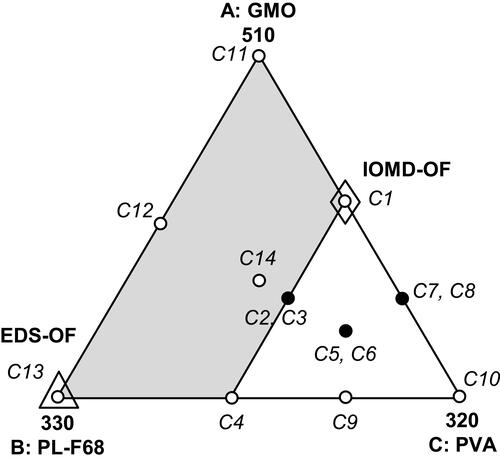
Figure 2 Release profiles of TAZA from trials (C1 – C14) compared with TAZA release from suspension.
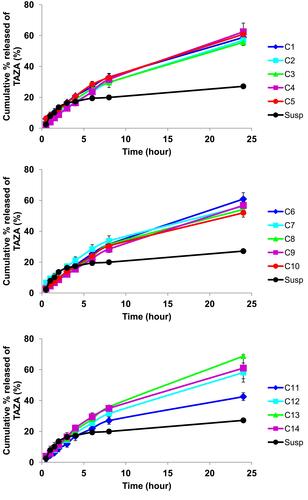
Figure 3 Contour plots showing the changes in (A) Entrapment efficiency, (B) Particle size, (C) Drug percent released after 24h (Q24h) and (D) desirability over the I-optimal mixture design space. Arrows represent regions of maximum: (C) Q24h and (D) desirability, ✖ represents the selected optimized formulation based on this design (IOMD-OF).
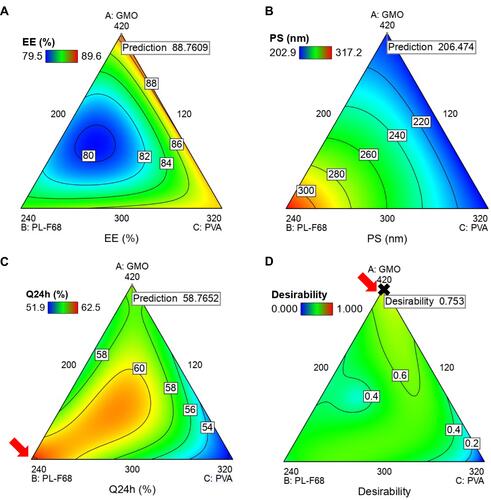
Table 3 Coefficient Estimates for Different Model Terms – Appearing in the Final Equations from the Expanded Mixture Design – for Each Response and Their Significance, Together with Models’ Types and Evaluation
Figure 4 Box-Cox plot for data transformation showing ln residual sum of squares (ln residual SS) without transformation and after recommended transformation for the responses: (A) Particle size, (B) Drug percent released after 24h.
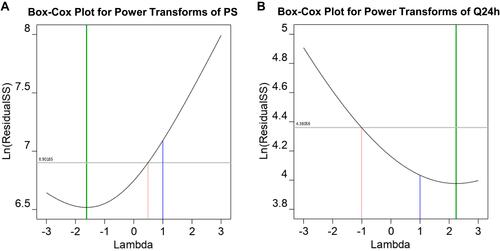
Figure 5 Contour plots and Piepel’s trace plots showing the changes in Entrapment efficiency (A and B), Particle size (C and D), Drug percent released after 24h (E and F) over the expanded mixture design space.
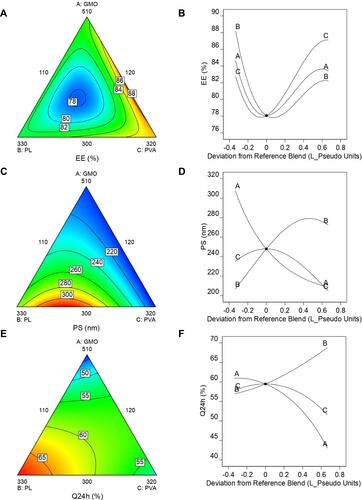
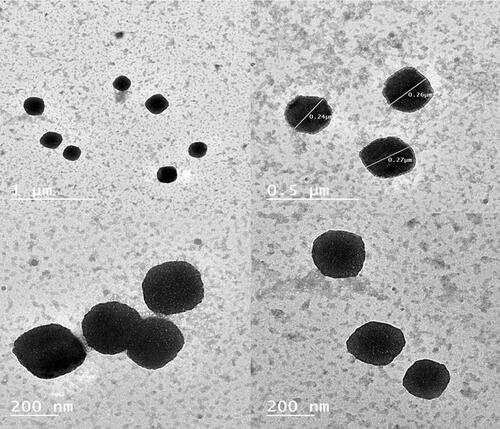
Figure 6 Transmission electron microscope morphological examination for stained expanded mixture design optimized formulation showing its cubic shape.