Figures & data
Table 1 Final concentration of selenium in the colloidal synthesis solution
Figure 1 Scanning electron microscopic images of PVC coated with selenium nanoparticles (right panel) and not coated with selenium nanoparticles (left panel). Arrows indicate selenium nanoparticles (nonexhaustive). The selenium nanoparticles had sizes ranging from approximately 80 nm to 200 nm and are uniformly coated on the substrates. Selenium nanoparticle coverage is approximately 10%, or 300 μg.Citation18 Previously published studies demonstrate the surface coverage for all samples of interest in this study, and are given in .Citation18
Abbreviation: PVC, polyvinyl chloride.
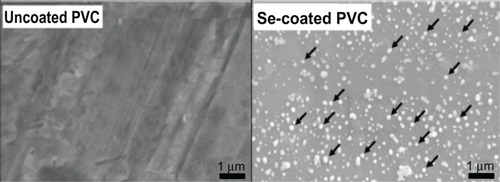
Figure 2 Scanning electron microscopic image, taken at a 45° tilt, of the medium concentration selenium nanoparticles precipitated on polyvinyl chloride.
Note: The hemispherical shape of the selenium nanoparticles on the substrate surface.
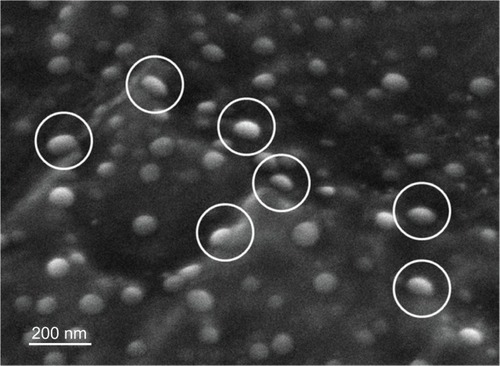
Figure 3 X-ray spectra of an uncoated region on PVC (top) and a region on PVC coated with selenium nanoparticles (bottom). Elemental selenium peaks are detected in PVC coated with selenium nanoparticles, demonstrating that the nanoparticles were in fact selenium. Peaks of carbon (C) and chlorine (Cl) present are from the PVC substrate; peaks of gold (Au) present are from the sputter-coating process.
Abbreviations: PVC, polyvinyl chloride; EDS, energy dispersive spectrum.
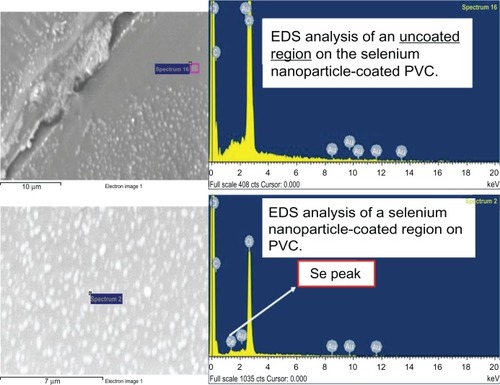
Figure 4 Water contact angles of PVC coated and not coated with selenium nanoparticles.
Notes: *P < 0.01 compared with uncoated PVC. The data are presented as the mean ± standard error of the mean (n = 3).
Abbreviation: PVC, polyvinyl chloride.
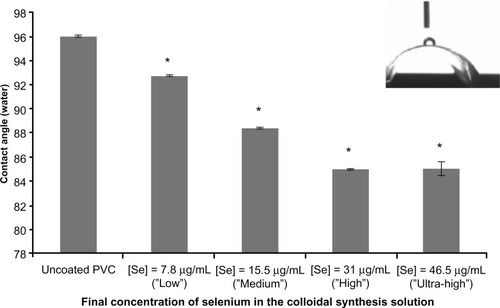
Figure 5 Increased fibroblast viability upon exposure to PVC coated with selenium nanoparticles.
Notes:*P < 0.05 for all concentrations at the 4-hour (adhesion) time point as compared with the control; †P < 0.01 for all concentrations at the 24-hour (proliferation) time point as compared with the control; #P < 0.01 for all concentrations at the 72-hour (proliferation) time point as compared with the control. The data are presented as the mean ± standard error of the mean (n = 3).
Abbreviation: PVC, polyvinyl chloride.
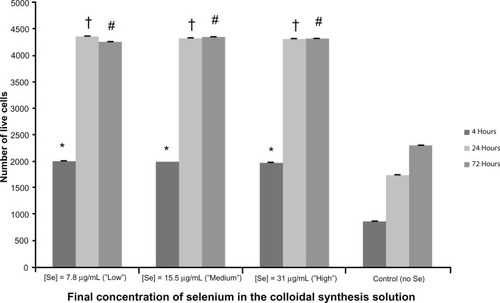
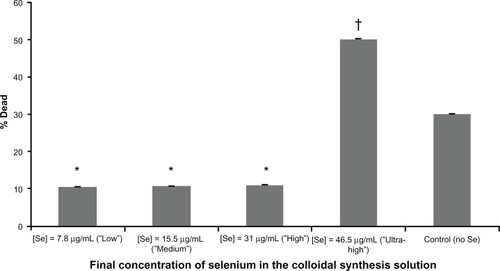
Figure 6 Half maximal inhibitory concentration (IC50 studies show a decrease in fibroblast viability after 72hours when exposed to the ultrahigh concentration of selenium nanoparticles.
Notes: *P < 0.05 for the high, medium, and low concentrations as compared with the control; †P < 0.01 for all concentrations at the ultra-high concentration as compared with the control. The data are presented as the mean ± standard error of the mean (n = 3).